Guidelines for Data Point Modeling
From XBRLWiki
| Revision as of 08:38, 25 November 2013 (edit) Katrin (Talk | contribs) ← Previous diff |
Current revision (09:07, 25 November 2013) (edit) Katrin (Talk | contribs) |
||
| Line 18: | Line 18: | ||
| This document is currently submitted to a public consultation. | This document is currently submitted to a public consultation. | ||
| - | == Introduction == | + | '''Introduction''' |
| - | + | ||
| ''General'' | ''General'' | ||
| - | The purpose of this document is to support supervisory experts in the creation of a Data Point Model (DPM). According to the definition of the European Banking Authority (EBA), a DPM “is a structured formal representation of the data [...] , identifying all the business concepts and its relations, as well as validation rules, oriented to all kinds of implementers.” | + | The purpose of this document is to support supervisory experts in the creation of a Data Point Model (DPM). According to the definition of the European Banking Authority (EBA), a DPM “is a structured formal representation of the data [...] , identifying all the business concepts and its relations, as well as validation rules, oriented to all kinds of implementers.”[EBA (2011a), p.22] |
| - | The underlying rules for the creation of such methods were initially introduced by the Eurofiling Initiative and developed further by the European Insurance and Occupational Pensions Authority (EIOPA). The main objective of data point modelling, the process of creating a DPM; “[it] should help to produce a better understanding of the legal background to the prudential reporting data and make data analysis much easier for both the institutions and regulators” . | + | |
| - | Further goals are to prevent redundancies, lower maintenance efforts and, in general, to facilitate working with national extensions on the European agreed-upon data set to facilitate the descriptions of requirements that are sharable across national legislations. It is a requirement to have all the information collected by the national supervisory agencies, particularly in Europe, transformed into the same data structure with the same quality in order to be able to carry out standardized analysis of the data across Europe. The current implementations are not able to meet these European requirements for supervision “to achieve higher quality and better comparability of data” . The main reasons for this are the differences between the data definitions and the data formats of the various national supervisory agencies, making comparison of reported data virtually impossible. | + | The underlying rules for the creation of such methods were initially introduced by the Eurofiling Initiative and developed further by the European Insurance and Occupational Pensions Authority (EIOPA). The main objective of data point modelling, the process of creating a DPM; “[it] should help to produce a better understanding of the legal background to the prudential reporting data and make data analysis much easier for both the institutions and regulators.” [EBA (2011a), p.30] |
| + | |||
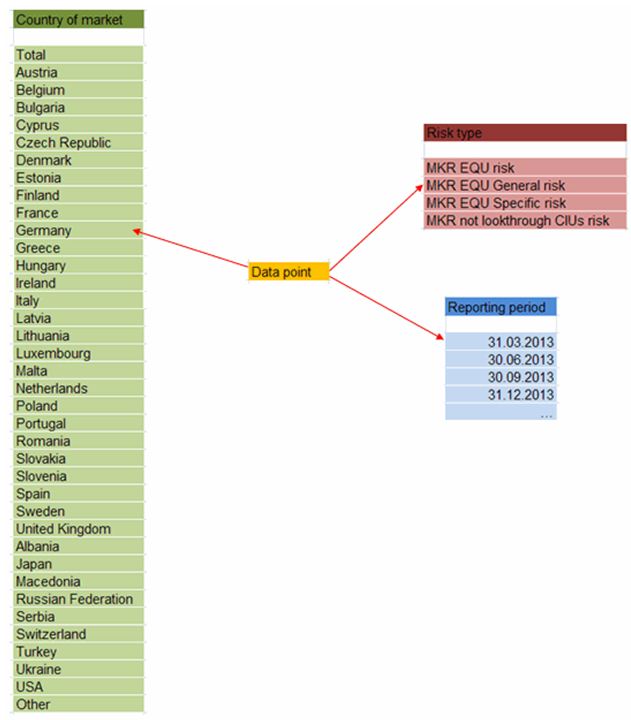
| + | Further goals are to prevent redundancies, lower maintenance efforts and, in general, to facilitate working with national extensions on the European agreed-upon data set to facilitate the descriptions of requirements that are sharable across national legislations. It is a requirement to have all the information collected by the national supervisory agencies, particularly in Europe, transformed into the same data structure with the same quality in order to be able to carry out standardized analysis of the data across Europe. The current implementations are not able to meet these European requirements for supervision “to achieve higher quality and better comparability of data” [EBA (2011a), p.29]. The main reasons for this are the differences between the data definitions and the data formats of the various national supervisory agencies, making comparison of reported data virtually impossible. | ||
| ''Objective'' | ''Objective'' | ||
| Line 101: | Line 102: | ||
| === General === | === General === | ||
| - | Data models outline the relationships between data. It is important that the person responsible for modelling takes the time to capture all relations between data that can be shown in the model. It is essential that the model is reviewed by third parties involved for errors to be identified in advance. Furthermore, it helps to get a clearly structured model that can save time and costs later. | + | Data models outline the relationships between data [Cf. Gartner (2012)]. It is important that the person responsible for modelling takes the time to capture all relations between data that can be shown in the model. It is essential that the model is reviewed by third parties involved for errors to be identified in advance. Furthermore, it helps to get a clearly structured model that can save time and costs later. |
| === The term “model” === | === The term “model” === | ||
| - | The term model has its origin in the Middle French noun “modelle”. In IT context, a model pictures a target-oriented system instead of directly intervening in the complex system. Specifically, in terms of data models, this means a real system, a system from the domain comprised of real components that are tangible and dynamic, which is mapped to a model to reduce complexity. This may help to find a suitable solution to an existing problem. The model needs to be created as close to reality as possible, with attention to requirements regarding structure and behaviour. Nevertheless, in order to raise the comprehensibility, aspects irrelevant for the purpose of modelling may be left out. The importance of a single aspect, and whether it is worth being specified in the model, depends on the decision of the domain experts. This strongly depends on the modeller’s understanding, creativity and capability to associate the object system with the model. | + | The term model has its origin in the Middle French noun “modelle” [Harper,D.(2013)]. In IT context, a model pictures a target-oriented system instead of directly intervening in the complex system [Cf. Ferstl, O./ Sinz,E. (2013), p. 22]. Specifically, in terms of data models, this means a real system, a system from the domain comprised of real components that are tangible and dynamic, which is mapped to a model to reduce complexity [Cf. ibidem, p. 20]. This may help to find a suitable solution to an existing problem. The model needs to be created as close to reality as possible, with attention to requirements regarding structure and behaviour. Nevertheless, in order to raise the comprehensibility, aspects irrelevant for the purpose of modelling may be left out. The importance of a single aspect, and whether it is worth being specified in the model, depends on the decision of the domain experts. This strongly depends on the modeller’s understanding, creativity and capability to associate the object system with the model. |
| - | The challenge of data modelling is that a data model “must be simple enough to communicate [it] to the end user [...] [and] [...] detailed enough for the database design to use it to create the physical structure“. The same principle applies to message design and its physical representation. | + | The challenge of data modelling is that a data model “must be simple enough to communicate [it] to the end user [...] [and] [...] detailed enough for the database design to use it to create the physical structure“ [ZaZa Network (2007)]. The same principle applies to message design and its physical representation. |
| In the following paragraph, the procedure of data-oriented modelling is presented. | In the following paragraph, the procedure of data-oriented modelling is presented. | ||
| Line 117: | Line 118: | ||
| As data is the focus point of the banking supervisors, the data-oriented process is applied. Additionally, in the course of time, data [objects] do not change as much as processes do. Functions are not being taken into account here. | As data is the focus point of the banking supervisors, the data-oriented process is applied. Additionally, in the course of time, data [objects] do not change as much as processes do. Functions are not being taken into account here. | ||
| - | Applying the data-oriented process, data objects are specified first, as well as the attributes that belong to each data object. The next step is to put the objects in relation to each other. Furthermore, the data model can imply integrity conditions and define operations that can be carried out on the data. | + | Applying the data-oriented process, data objects are specified first, as well as the attributes that belong to each data object. The next step is to put the objects in relation to each other. Furthermore, the data model can imply integrity conditions and define operations that can be carried out on the data [Cf. Baeumle-Courth P../Nieland S./Schröder H. (2004), p.56]. |
| === The conceptual data model as a first step aiming for a database system === | === The conceptual data model as a first step aiming for a database system === | ||
| Line 126: | Line 127: | ||
| ;Figure 1 - Levels of data-oriented modelling.jpg | ;Figure 1 - Levels of data-oriented modelling.jpg | ||
| - | The conceptual data model reflects your reporting requirements. You are in the best position to know what pieces of information are requested. The conceptual model helps you in the communication with your IT specialists. This is an important step to avoid unpleasant surprises later when the model is implemented in the IT department. The model is built regardless of the database system or data warehouse to be used. Relevant facts of the object system are to be specified without loss of information. However, you, as the creators of the conceptual model do not need to be technically skilled because the succeeding steps of data modelling are carried out by IT specialists. They should be concerned about the technical requirements. It is very important that this first step of preparing the conceptual data model is carefully elaborated before transferring the information to the IT. This can be ensured by early reviews, which include all parties concerned. | + | The conceptual data model reflects your reporting requirements. You are in the best position to know what pieces of information are requested. The conceptual model helps you in the communication with your IT specialists. This is an important step to avoid unpleasant surprises later when the model is implemented in the IT department. The model is built regardless of the database system or data warehouse to be used [Cf. 1keydata (2013a)]. Relevant facts of the object system are to be specified without loss of information. However, you, as the creators of the conceptual model do not need to be technically skilled because the succeeding steps of data modelling are carried out by IT specialists. They should be concerned about the technical requirements. It is very important that this first step of preparing the conceptual data model is carefully elaborated before transferring the information to the IT. This can be ensured by early reviews, which include all parties concerned. |
| - | The logical data model, as well as the physical data model, is prepared by the IT specialists. In essence, the logical data model immediately follows the conceptual model (see Figure 1). When aimed at a database approach, in contrast to the conceptual model, it also takes the requirements of the database or the data warehouse into account. The physical data model, as a final step, describes the actual implementation into an existing database system. | + | The logical data model, as well as the physical data model, is prepared by the IT specialists. In essence, the logical data model immediately follows the conceptual model (see Figure 1). When aimed at a database approach, in contrast to the conceptual model, it also takes the requirements of the database or the data warehouse into account [Cf. 1keydata (2013b)]. The physical data model, as a final step, describes the actual implementation into an existing database system [Cf. 1keydata (2013c)]. |
| === Description of data modelling approaches for supervisory purposes === | === Description of data modelling approaches for supervisory purposes === | ||
| Line 139: | Line 140: | ||
| Definitions for data and metadata are given below: | Definitions for data and metadata are given below: | ||
| - | Data is “information processed or stored by a computer. This information may be in the form of text documents, images, audio clips, software programs, or other types of data. Computer data may be processed by the computer's CPU and is stored in files and folders on the computer's hard disk.” | + | Data is “information processed or stored by a computer. This information may be in the form of text documents, images, audio clips, software programs, or other types of data. Computer data may be processed by the computer's CPU and is stored in files and folders on the computer's hard disk.” [TechTerms (2013a)] |
| - | Metadata “describes data. It provides information about a certain item's content.“ | + | |
| + | Metadata “describes data. It provides information about a certain item's content.“ [TechTerms (2013b)] | ||
| While data is a number like “50”, the metadata adds qualifying information to the number. The explanation on the “form centric” and the “data centric” modelling approaches will clarify the difference. | While data is a number like “50”, the metadata adds qualifying information to the number. The explanation on the “form centric” and the “data centric” modelling approaches will clarify the difference. | ||
| Line 149: | Line 151: | ||
| [[Image:Table MKR SA EQU as an example of a form centric approach.jpg]] | [[Image:Table MKR SA EQU as an example of a form centric approach.jpg]] | ||
| - | ;Figure 2 — Table MKR SA EQU as an example of a form centric approach | + | ;Figure 2 — Table MKR SA EQU as an example of a form centric approach [EBA (2013)] |
| The “form centric” approach is oriented as the visualization of the data. Dependencies between the codes of the data are only shown in the templates, i.e., by identifying the appropriate headlines or by the indents of the label rows. A report based on the “form centric” approach, which uses codes for the identification of data, is not able to incorporate the dependencies visibly. | The “form centric” approach is oriented as the visualization of the data. Dependencies between the codes of the data are only shown in the templates, i.e., by identifying the appropriate headlines or by the indents of the label rows. A report based on the “form centric” approach, which uses codes for the identification of data, is not able to incorporate the dependencies visibly. | ||
| Line 169: | Line 171: | ||
| - qualifying information; | - qualifying information; | ||
| - | - quantifying information. | + | - quantifying information [Cf. Sapia, C. / et al (1999)]. |
| Qualifying information is represented by attributes to certain categories, while quantifying information describes the object evaluated. | Qualifying information is represented by attributes to certain categories, while quantifying information describes the object evaluated. | ||
| Line 178: | Line 180: | ||
| ;Figure 4 — Dimensional model for MKR SA EQU | ;Figure 4 — Dimensional model for MKR SA EQU | ||
| - | One Data Point is represented by one cell of the table in the “form centric” approach. Going back to the example above used to explain the “form centric” approach, defining the cell by a combination of row and column codes (like r021c010), we have got a Data Point specified by a dimensioned element with its corresponding dimensions indicating the various regions. One possible dimension, for example, that can be derived looking at the table in Figure 2 is the risk type dimension. Various types of risk are listed in the rows of this table: “general risk” and “specific risk” are reasonable attributes for the risk type dimension. To identify the risk types, business knowledge is needed. We cannot rely on the nesting (tabs) in the table as they might be used differently amongst table creators for presentation purposes. Each dimensioned element is characterised by a variable number of dimensions. Each dimension is linked to one attribute, called a member, to characterise the Data Point. The dimensions represent the “by” conditions. Dimensions literally describe the dimensioned elements in order to limit the range of interpretation, and thereby qualify a dimensioned element. One dimension either has a definite (i.e. countable) number of elements, which is called an enumerable dimension, or an unknown list of members to the regulator, which is called a non enumerable dimension . | + | One Data Point is represented by one cell of the table in the “form centric” approach. Going back to the example above used to explain the “form centric” approach, defining the cell by a combination of row and column codes (like r021c010), we have got a Data Point specified by a dimensioned element with its corresponding dimensions indicating the various regions. One possible dimension, for example, that can be derived looking at the table in Figure 2 is the risk type dimension. Various types of risk are listed in the rows of this table: “general risk” and “specific risk” are reasonable attributes for the risk type dimension. To identify the risk types, business knowledge is needed. We cannot rely on the nesting (tabs) in the table as they might be used differently amongst table creators for presentation purposes. Each dimensioned element is characterised by a variable number of dimensions. Each dimension is linked to one attribute, called a member, to characterise the Data Point. The dimensions represent the “by” conditions. Dimensions literally describe the dimensioned elements in order to limit the range of interpretation, and thereby qualify a dimensioned element. One dimension either has a definite (i.e. countable) number of elements, which is called an enumerable dimension, or an unknown list of members to the regulator, which is called a non enumerable dimension [Cf. Declerck, T./ Hommes, R./ Heinze, K. (2013)]. |
| Members are attributes that can be assigned to a dimension. As members are often used for various dimensions, domains are introduced in order to reduce redundancy. Each domain contains semantically correlated members that can be used throughout the whole of the reporting framework. The dimension represents the semantic relevance for the specific use on the dimensioned element. All members are added to at least one domain that can be reused by a variety of dimensions. | Members are attributes that can be assigned to a dimension. As members are often used for various dimensions, domains are introduced in order to reduce redundancy. Each domain contains semantically correlated members that can be used throughout the whole of the reporting framework. The dimension represents the semantic relevance for the specific use on the dimensioned element. All members are added to at least one domain that can be reused by a variety of dimensions. | ||
| Line 188: | Line 190: | ||
| === Description of dimensional modelling === | === Description of dimensional modelling === | ||
| - | Dimensional modelling is the innovative modelling type to create multidimensional data models. Depending on the conditions, the dimensional model may be “simpler, more expressive, and easier to understand” than divergent modelling techniques. Dimensional modelling is used by the data centric approach, introducing dimensions to qualify the information that consists of numeric data, including values, counts, weights, balances and occurrences. The main information about the datum, i.e., the data type of the fact, is held in the dimensioned element, which is verified here by the amount type dimension as it contains crucial information about the Data Point to be specified. Further qualifying information that is associated with the Data Point is specified by the members of the applied dimensions. | + | Dimensional modelling is the innovative modelling type to create multidimensional data models. Depending on the conditions, the dimensional model may be “simpler, more expressive, and easier to understand” [Ballard, C./et al (1998), p. 42] than divergent modelling techniques. Dimensional modelling is used by the data centric approach, introducing dimensions to qualify the information that consists of numeric data, including values, counts, weights, balances and occurrences. The main information about the datum, i.e., the data type of the fact, is held in the dimensioned element, which is verified here by the amount type dimension as it contains crucial information about the Data Point to be specified. Further qualifying information that is associated with the Data Point is specified by the members of the applied dimensions [Cf. Ballard, C./et al (1998), p. 42]. |
| [[Image:Example of a dimensioned element with corresponding dimensions.jpg]] | [[Image:Example of a dimensioned element with corresponding dimensions.jpg]] | ||
| ;Figure 5 — Example of a dimensioned element with corresponding dimensions for the cell r021c010 marked in MKR SA EQU | ;Figure 5 — Example of a dimensioned element with corresponding dimensions for the cell r021c010 marked in MKR SA EQU | ||
| - | The term ‘metrics’ is used as a synonym for ‘dimensioned element’ in other sources. However, for the rest of this paper the term dimensioned element is used. Taken literally, it is the one that is defined by the application of dimension-member combinations. | + | The term ‘metrics’ is used as a synonym for ‘dimensioned element’ in other sources [Declerck, T./ Hommes, R./ Heinze, K. (2013)]. However, for the rest of this paper the term dimensioned element is used. Taken literally, it is the one that is defined by the application of dimension-member combinations. |
| === The concept of normalisation === | === The concept of normalisation === | ||
| Line 229: | Line 231: | ||
| It is still not yet known who reported the figures. Furthermore, there is no definition of the axes´ members. The members that add qualified information about a single value need to be specified in order to prevent discrepancies in the interpretation of readers. The task now is to check what level of detail is required for the facts reported, in order to carry out the required analysis at a later stage. On the basis of this decision, abstract categories are created. It is advised to carry out this task in a team of experts. | It is still not yet known who reported the figures. Furthermore, there is no definition of the axes´ members. The members that add qualified information about a single value need to be specified in order to prevent discrepancies in the interpretation of readers. The task now is to check what level of detail is required for the facts reported, in order to carry out the required analysis at a later stage. On the basis of this decision, abstract categories are created. It is advised to carry out this task in a team of experts. | ||
| - | For example, if we want to analyse the credit risks taken, it might be important not only to obtain knowledge about the countries where the risk was taken, but also about the different regions within the countries because this might reveal a difference in the risk aversion within the various regions (Figure 7). Therefore, it is not sufficient to name a category “country” and list below all countries. Referring to the mentioned example, a further breakdown is needed that lists the regions of each country. For these different levels of detail, a hierarchy can be defined in order to derive aggregated information about one country, or one continent at a later time. A sample breakdown with selected continents, countries and regions is shown below. | + | For example, if we want to analyse the credit risks taken, it might be important not only to obtain knowledge about the countries where the risk was taken, but also about the different regions within the countries because this might reveal a difference in the risk aversion within the various regions (Figure 7). Therefore, it is not sufficient to name a category “country” and list below all countries. Referring to the mentioned example, a further breakdown is needed that lists the regions of each country. For these different levels of detail, a hierarchy can be defined in order to derive aggregated information about one country, or one continent at a later time [Santos I, Castro E (2011)]. A sample breakdown with selected continents, countries and regions is shown below. |
| [[Image:Hierarchy of countries to show different levels of detail.jpg]] | [[Image:Hierarchy of countries to show different levels of detail.jpg]] | ||
| Line 251: | Line 253: | ||
| Once domains are created, they can be assigned to a variety of dimensions. That prevents redundancy of members and defines them uniquely for satisfying the requirements of communication via computers. This step is called normalisation. A technical definition for normalisation is as follows: | Once domains are created, they can be assigned to a variety of dimensions. That prevents redundancy of members and defines them uniquely for satisfying the requirements of communication via computers. This step is called normalisation. A technical definition for normalisation is as follows: | ||
| - | Normalisation is the transfer of a data model to a certain state. The various states are differentiated by levels of the 'normal form' and achieved by applying them to the data model. The third normal form is enough to prevent redundancies and inconsistencies. Therefore, the maintenance of stored data is facilitated by applying the third normal form. | + | Normalisation is the transfer of a data model to a certain state. The various states are differentiated by levels of the 'normal form' and achieved by applying them to the data model. The third normal form is enough to prevent redundancies and inconsistencies. Therefore, the maintenance of stored data is facilitated by applying the third normal form [Cf. Minhorst, A. (2005), p. 49]. |
| To achieve this, the two main aims are: | To achieve this, the two main aims are: | ||
| - | - arranging data into logical groups, such that each group describes a small part of the whole ; | + | - arranging data into logical groups, such that each group describes a small part of the whole [databasedev (2013)]; |
| - | - restricting to the level of detail needed . | + | - restricting to the level of detail needed [Heinze, K. (2013)]. |
| In order to bring your data model into the third normalised form, you need to group members in domains and make sure that the domains do not overlap. It must be possible to unambiguously assign the members to a single domain. Therefore it is important to use meaningful names for members, domains and dimensions. It is also advised to prepare a handbook where the names are differentiated. Following these rules, consistency throughout the model can be achieved. | In order to bring your data model into the third normalised form, you need to group members in domains and make sure that the domains do not overlap. It must be possible to unambiguously assign the members to a single domain. Therefore it is important to use meaningful names for members, domains and dimensions. It is also advised to prepare a handbook where the names are differentiated. Following these rules, consistency throughout the model can be achieved. | ||
| Line 263: | Line 265: | ||
| === Introduction === | === Introduction === | ||
| - | The data in the conceptual model can be modelled dimensionally as well as hierarchically . The reason it is advised to create a multidimensional data model, is that it is closer to the presentation form that the user is accustomed to, and therefore easier for him to understand. | + | The data in the conceptual model can be modelled dimensionally as well as hierarchically [Collins, J. (2013)]. The reason it is advised to create a multidimensional data model, is that it is closer to the presentation form that the user is accustomed to, and therefore easier for him to understand. |
| === Multidimensional data model === | === Multidimensional data model === | ||
| Line 276: | Line 278: | ||
| The multidimensional data model visualised by a cube is specified by three categories: risk type, reporting period and country of market. These categories are referred to as dimensions and, as stated before, serve as examples for qualifying information. The single cells that make up the cube carry quantifying information. Most of the time Data Points hold values that can be summed upon demand. | The multidimensional data model visualised by a cube is specified by three categories: risk type, reporting period and country of market. These categories are referred to as dimensions and, as stated before, serve as examples for qualifying information. The single cells that make up the cube carry quantifying information. Most of the time Data Points hold values that can be summed upon demand. | ||
| - | The dimensions risk type, reporting period and country of market that show a semantic relationship between them are used to specify an orthogonal structure to the data space. | + | The dimensions risk type, reporting period and country of market that show a semantic relationship between them are used to specify an orthogonal [meeting at a right angle] structure to the data space. |
| It is possible to carry out arithmetic operations on the numeric values in each cell. | It is possible to carry out arithmetic operations on the numeric values in each cell. | ||
| Line 286: | Line 288: | ||
| === Operations that can be carried out on a multidimensional data model === | === Operations that can be carried out on a multidimensional data model === | ||
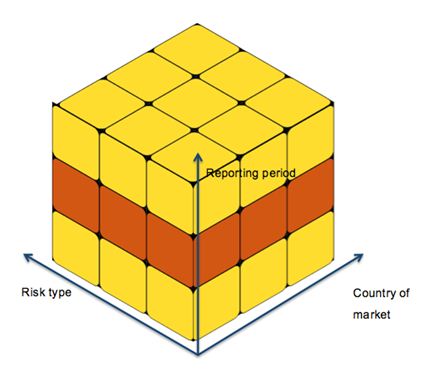
| - | It is possible to create individual views on the present extensive multidimensional data model. One approach is to look at slices of the large whole. This is often visualised by referring to a single selected domain of one of the dimensions, and, therefore, receiving figuratively a slice of the cube. Actually, one might say that one dimension is not taken into account with this view of the cube. | + | It is possible to create individual views on the present extensive multidimensional data model. One approach is to look at slices of the large whole. This is often visualised by referring to a single selected domain of one of the dimensions, and, therefore, receiving figuratively a slice of the cube. Actually, one might say that one dimension is not taken into account with this view of the cube [Cf. Verma, R. (2009a)]. |
| [[Image:Slicing visualised.jpg]] | [[Image:Slicing visualised.jpg]] | ||
| Line 293: | Line 295: | ||
| Referring to the example cube shown in Figure 10, we focus on the orange highlighted part. By slicing, we get all reported risk types of all countries of market at a certain reporting period. Whether the reporting period situated on this dimension is a domain describing days, months, quarters of the year, or even whole years, remains to be seen. | Referring to the example cube shown in Figure 10, we focus on the orange highlighted part. By slicing, we get all reported risk types of all countries of market at a certain reporting period. Whether the reporting period situated on this dimension is a domain describing days, months, quarters of the year, or even whole years, remains to be seen. | ||
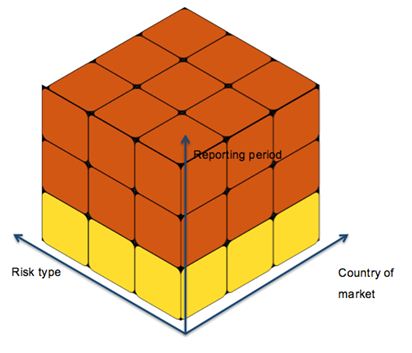
| - | With dicing, in contrast to slicing, all dimensions remain considered. The process of dicing figuratively cuts a hexahedron out of the big cube. Adhering to the same example, Figure 11 pictures the effect of dicing. According to the model cube, one attribute on the reporting period dimension is excluded for the analysis. Therefore, dicing results in a new hexahedron that is smaller than the original cube. | + | With dicing, in contrast to slicing, all dimensions remain considered. The process of dicing figuratively cuts a hexahedron out of the big cube. Adhering to the same example, Figure 11 pictures the effect of dicing. According to the model cube, one attribute on the reporting period dimension is excluded for the analysis. Therefore, dicing results in a new hexahedron that is smaller than the original cube [Cf. Verma, R. (2009b)]. |
| [[Image:Dicing visualised.jpg]] | [[Image:Dicing visualised.jpg]] | ||
| Line 308: | Line 310: | ||
| === Objective of Data Point modelling === | === Objective of Data Point modelling === | ||
| - | The Eurofiling Initiative is about to set a syntax standard for collecting information for supervisory and statistical reporting. The aim is to benefit from international solutions instead of proprietary ones. For example, validation software for data received, mapping software for transforming the collected data into databases, and rendering software to make the exchanged data visible to parties that are not directly involved in the communication process, like accountants and actuaries. The data format to which a DPM can be transferred later is variable. At present, the preferred standard syntax is a format called Extensible Business Reporting Language (XBRL). It was chosen because of its characteristics being adapted to the requirements of the financial sector. The use of XBRL does not imply an enforced standardisation of business reporting. On the contrary, the syntax is a flexible one which is intended to support all current aspects of reporting in different countries and industries. Its extensible nature means that it can be adjusted to meet particular business requirements, even at the individual organization level. | + | The Eurofiling Initiative is about to set a syntax standard for collecting information for supervisory and statistical reporting. The aim is to benefit from international solutions instead of proprietary ones. For example, validation software for data received, mapping software for transforming the collected data into databases, and rendering software to make the exchanged data visible to parties that are not directly involved in the communication process, like accountants and actuaries. The data format to which a DPM can be transferred later is variable. At present, the preferred standard syntax is a format called Extensible Business Reporting Language (XBRL).[Cf. Piechocki, M. (2012)] It was chosen because of its characteristics being adapted to the requirements of the financial sector. The use of XBRL does not imply an enforced standardisation of business reporting. On the contrary, the syntax is a flexible one which is intended to support all current aspects of reporting in different countries and industries. Its extensible nature means that it can be adjusted to meet particular business requirements, even at the individual organization level. |
| - | Moreover, the EBA has given signals that XBRL will be the format that it will require to receive the data collected by national authorities. | + | Moreover, the EBA has given signals that XBRL will be the format that it will require to receive the data collected by national authorities [Cf. EBA (2011a)]. |
| The four main reasons for modelling Data Points (whether using XBRL or not remains to be seen) are illustrated in the following paragraphs. | The four main reasons for modelling Data Points (whether using XBRL or not remains to be seen) are illustrated in the following paragraphs. | ||
| Line 329: | Line 331: | ||
| ==== Improvement of integration of changes ==== | ==== Improvement of integration of changes ==== | ||
| - | With a well-designed Data Point Model, it can be ensured that the data structure is defined explicitly and without redundancies. This means that no single fact is described in two different ways. Therefore, every single piece of information is unique. If more information is required, qualifying aspects may be added to the fact in conjunction with the construction of a new dimension, as needed. Figure 13 shows this case. | + | With a well-designed Data Point Model, it can be ensured that the data structure is defined explicitly and without redundancies. This means that no single fact is described in two different ways. Therefore, every single piece of information is unique. If more information is required, qualifying aspects may be added to the fact in conjunction with the construction of a new dimension, as needed. Figure 13 shows this case [Heinze,K. (2012), p. 79]. |
| [[Image:Extensibility of Data Point Model is shown by adding a portfolio-dimension.jpg]] | [[Image:Extensibility of Data Point Model is shown by adding a portfolio-dimension.jpg]] | ||
| Line 340: | Line 342: | ||
| This goal refers to the avoidance of duplicate information. With normalization on Modelling Data Points, dimensions and members can be reused. As explained in previous sections, it is advised to combine members in a domain, possibly also sub-domains, which can then be associated with a dimension. Hierarchies are defined as group sub-domains of already existing domains. | This goal refers to the avoidance of duplicate information. With normalization on Modelling Data Points, dimensions and members can be reused. As explained in previous sections, it is advised to combine members in a domain, possibly also sub-domains, which can then be associated with a dimension. Hierarchies are defined as group sub-domains of already existing domains. | ||
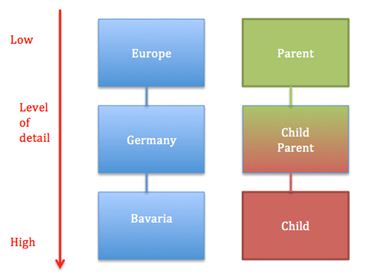
| - | Most of the time, we can identify different levels of detail for members of one domain. This means that a kind of natural hierarchy is formed. You can represent these members of different levels of detail by sub-domains. We try to represent these relationships as hierarchies because this information can be reused for the definition of rules for calculations (total has individual facts). Hierarchical presentation and understanding how members are interrelated are further purposes of defining hierarchies. In hierarchical modelling, this is called a parent-child relationship, which is figuratively shown in Figure 14. | + | Most of the time, we can identify different levels of detail for members of one domain. This means that a kind of natural hierarchy is formed. You can represent these members of different levels of detail by sub-domains. We try to represent these relationships as hierarchies because this information can be reused for the definition of rules for calculations (total has individual facts). Hierarchical presentation and understanding how members are interrelated are further purposes of defining hierarchies. In hierarchical modelling, this is called a parent-child relationship, which is figuratively shown in Figure 14 [Cf. IBM (w.y)]. |
| [[Image:Shows the relations of the parent-child relationships with Germany in the focus.jpg]] | [[Image:Shows the relations of the parent-child relationships with Germany in the focus.jpg]] | ||
| Line 378: | Line 380: | ||
| [[Image:Dovetail connection between different common reporting frameworks.jpg]] | [[Image:Dovetail connection between different common reporting frameworks.jpg]] | ||
| - | ;Figure 18 — Dovetail connection between different common reporting frameworks | + | ;Figure 18 — Dovetail connection between different common reporting frameworks [EBA (2011b), p.50] |
| === Classification of Data Point modelling in the data modelling concept === | === Classification of Data Point modelling in the data modelling concept === | ||
| Line 408: | Line 410: | ||
| === What are the technical constraints === | === What are the technical constraints === | ||
| - | Attention should be paid to some rules that are listed below. The source of these constraints is a Wiki that started off as a joint venture of XBRL Spain and the University of Bucaramanga. , the aim of which is to develop a standard that is adopted by all parties, and anyone interested is welcome to contribute ideas to the wiki. Amendments and additions to the content of the wiki are still possible and, therefore, the rules listed below are not final. It is assumed that additional constraints will evolve in the future, as more and more people determine points of contact relating to the concepts of Data Point modelling and XBRL. It is strongly recommended that you follow these rules, as well as those in the wiki. | + | Attention should be paid to some rules that are listed below. The source of these constraints is a Wiki that started off as a joint venture of XBRL Spain and the University of Bucaramanga [Cf. XBRL Spain (2012)]. , the aim of which is to develop a standard that is adopted by all parties, and anyone interested is welcome to contribute ideas to the wiki. Amendments and additions to the content of the wiki are still possible and, therefore, the rules listed below are not final. It is assumed that additional constraints will evolve in the future, as more and more people determine points of contact relating to the concepts of Data Point modelling and XBRL. It is strongly recommended that you follow these rules, as well as those in the wiki. |
| For the DPM, there are a couple of important constraints in connection with hierarchies: | For the DPM, there are a couple of important constraints in connection with hierarchies: | ||
| Line 418: | Line 420: | ||
| 3) The hierarchy is built upon rules that are defined in a set of hierarchy relationships. | 3) The hierarchy is built upon rules that are defined in a set of hierarchy relationships. | ||
| - | 4) Each hierarchy has to be built from exactly one root element. | + | 4) Each hierarchy has to be built from exactly one root element [Cf. Declerck, T./ Hommes, R./ Heinze, K. (2013)]. |
| Moreover, when using XBRL, additional rules to those defined for the DPM must be considered., especially working with domains: | Moreover, when using XBRL, additional rules to those defined for the DPM must be considered., especially working with domains: | ||
| Line 428: | Line 430: | ||
| 7) One dimension has to point to at least one domain or sub-domain. | 7) One dimension has to point to at least one domain or sub-domain. | ||
| - | 8) Each member must be unique. | + | 8) Each member must be unique [Cf. ibidem]. |
| - | The most current and complete list of all constraints can be found at the wiki, which is “regularly updated with the help of the Eurofiling Initiative and XBRL Spain” . The filing rules in particular are updated by a CEN (European Committee for Standardisation) workshop. | + | The most current and complete list of all constraints can be found at the wiki, which is “regularly updated with the help of the Eurofiling Initiative and XBRL Spain” [XBRL Spain (2012)]. The filing rules in particular are updated by a CEN (European Committee for Standardisation) workshop [Cf. CEN (2009)]. |
| == How do you proceed in creating a Data Point Model == | == How do you proceed in creating a Data Point Model == | ||
| Line 534: | Line 536: | ||
| === What the future holds for us === | === What the future holds for us === | ||
| - | In order to help you in your task to create and review Data Point Models, software has been developed. As the marketplace realises the possibility of increased sales, new applications for the creation of XBRL taxonomies will be introduced soon. One program that is considered user-friendly for the purpose of creating a DPM is DPM Architect for XBRL, developed by the Banco de España and first introduced at XBRL Week in May 2012. The software cannot only help you to build up and review the DPM, it is also intended to generate XBRL taxonomies, which is the next step in the process. The MKR SA EQU template is used again as an example to show some excerpts of the implementation process for creating a DPM with DPM Architect. | + | In order to help you in your task to create and review Data Point Models, software has been developed. As the marketplace realises the possibility of increased sales, new applications for the creation of XBRL taxonomies will be introduced soon. One program that is considered user-friendly for the purpose of creating a DPM is DPM Architect for XBRL, developed by the Banco de España and first introduced at XBRL Week in May 2012. [Banco de España (2012)] The software cannot only help you to build up and review the DPM, it is also intended to generate XBRL taxonomies, which is the next step in the process. The MKR SA EQU template is used again as an example to show some excerpts of the implementation process for creating a DPM with DPM Architect. |
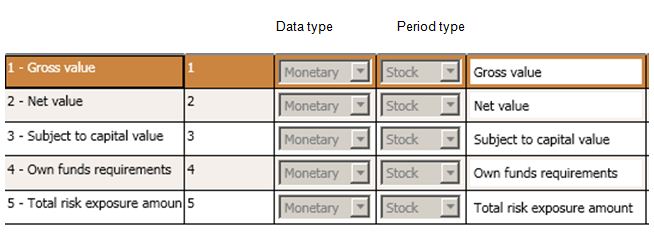
| The amount type dimension was selected to serve as dimensioned element. Applicable characteristics of the amount type of the MKR SA EQU framework are shown in Figure 24. | The amount type dimension was selected to serve as dimensioned element. Applicable characteristics of the amount type of the MKR SA EQU framework are shown in Figure 24. | ||
| Line 563: | Line 565: | ||
| ;Figure 28 — Table generated by DPM Architect to summarise the information given during the creation process of the DPM | ;Figure 28 — Table generated by DPM Architect to summarise the information given during the creation process of the DPM | ||
| - | The tool is already available for testers, and is used to produce taxonomies in production at the Banco de España. DPM Architect will be published on Banco de España´s website this year. Currently, Banco de España is providing the tool only upon request. | + | The tool is already available for testers, and is used to produce taxonomies in production at the Banco de España. DPM Architect will be published on Banco de España´s website this year. Currently, Banco de España is providing the tool only upon request [Banco de España (2012)]. |
| == Bibliography == | == Bibliography == | ||
Current revision
CEN WS XBRL Experts: Anna-Maria Weber (Deutsche Bundesbank)
Foreword
This document has been prepared by CEN/WS XBRL, under the supervision of the Secretariat of the Netherlands Standardization Institute (NEN).
CWA XBRL 001 consists of the following parts, under the general title Improving transparency in financial and business reporting — Harmonisation topics:
- Part 1: European data point methodology for supervisory reporting
- Part 2: Guidelines for data point modelling
- Part 3: European XBRL Taxonomy Architecture
- Part 4: European Filing Rules
This document is currently submitted to a public consultation.
Introduction General
The purpose of this document is to support supervisory experts in the creation of a Data Point Model (DPM). According to the definition of the European Banking Authority (EBA), a DPM “is a structured formal representation of the data [...] , identifying all the business concepts and its relations, as well as validation rules, oriented to all kinds of implementers.”[EBA (2011a), p.22]
The underlying rules for the creation of such methods were initially introduced by the Eurofiling Initiative and developed further by the European Insurance and Occupational Pensions Authority (EIOPA). The main objective of data point modelling, the process of creating a DPM; “[it] should help to produce a better understanding of the legal background to the prudential reporting data and make data analysis much easier for both the institutions and regulators.” [EBA (2011a), p.30]
Further goals are to prevent redundancies, lower maintenance efforts and, in general, to facilitate working with national extensions on the European agreed-upon data set to facilitate the descriptions of requirements that are sharable across national legislations. It is a requirement to have all the information collected by the national supervisory agencies, particularly in Europe, transformed into the same data structure with the same quality in order to be able to carry out standardized analysis of the data across Europe. The current implementations are not able to meet these European requirements for supervision “to achieve higher quality and better comparability of data” [EBA (2011a), p.29]. The main reasons for this are the differences between the data definitions and the data formats of the various national supervisory agencies, making comparison of reported data virtually impossible.
Objective
The aim to harmonise the European supervisory reporting is to be able to carry out more comprehensive analysis and an increase of comparability of data. Since the supervisory agencies are already acquainted with the representation of regulations specified in laws, this document is going to introduce the reader to the concept of Data Point modelling methodology, as well as to its main terms and definitions that will enable you to create Data Point Models that contain “all the relevant technical specifications necessary for developing an IT reporting format” on your own.
Target audience
In general, as a banking supervisor you are responsible for communicating with Information Technology (IT) experts in order to support the transfer of the essence of regulatory reporting to IT systems. In 2009, the Eurofiling Initiative published the concept of Data Point modelling. Structures of data represented in supervisory tables, as well as underlying laws and guidelines, were defined in order to enable the interpretation of the reporting information by IT applications. IT specialists are responsible for the development of software. However, most of the time they do not have the special business knowledge needed to gather reporting requirements from various sources, such as legal texts like Solvency Regulations and National Banking Acts, in order to build a flawless system. Therefore, the task of creating a DPM is assigned to you. This document introduces the basic principles deemed necessary in the modelling process. On the basis of the explanations given in this document, you will be able to provide prerequisites for deriving data formats on the basis of a DPM, as well as setting up a powerful data warehouse. This implies that the model is published in a format that is understood by both parties involved in transforming legislation into a model: business experts and IT specialists. The topics regarding supervisory reporting are kept short and limited to the content relevant for this paper. The idea is to convey the creation of the Data Point Model to you, as you are a supervisor with analytical capabilities and personal interest in this topic. No special IT knowledge is expected. The first sections will give you an overview on the required IT knowledge. National banking supervisors have a mandate to evaluate the financial situation of financial institutions in their country. To be able to perform the necessary analytics, financial data is required from these institutions. The requirements are described in the form of texts and tables of data. To make a comprehensive model from these texts and tables, a model is being created to enable IT support in communicating and storing the necessary data. A common problem with the National Supervisory Authorities (NSA's) is that IT staff has little financial background and financial specialists have little IT background. This makes data modelling a problematic area, as both specialities are needed. This document is aimed at providing the tools and knowledge of creating a DPM by the financial specialists. The result, a model, can be perfected by IT staff later in the process.
Scope
This paper is a handbook for supervising experts. The main body consists of four sections. The interrogative form helps in choosing which section may best answer your question, and lead you to a good understanding of the subject matter.. After this first introductory section and the section containing terms and definitions, the main part starts to provide basic knowledge about different types of data models and data modelling approaches. The first and the second sections provide an overview of data models in general, in contrast to the third section that highlights the necessity of data modelling for supervisory data. This third section draws on the objectives and background information of the preceding sections. Furthermore, a paragraph classifies the Data Point Model introduced by the Eurofiling Initiative and elaborated by EIOPA and EBA, where many new terms related to DPM are introduced. Another paragraph explains the areas of application for the DPM. The third section concludes with a paragraph introducing a subset of the technical constrains that need to be considered in the creation process of the DPM. The fourth section gives step-by-step instructions on how to create a DPM. The paper concludes with remarks on the progress achieved so far, and provides an outlook on the software that is being developed at the moment to support you during the creation process.
Terms and definitions
For the purposes of this document, the following terms and definitions apply.
NOTE The terms and definitions used in connection with Data Point modelling are inspired by vocabulary already known through their use in describing multidimensional databases and data warehouses. IT specialists originally introduced these terms. However, for an understanding and creation of Data Point Models, they are now established in the language of business specialists as well.
DataPoint A Data Point can be compared to a cell in a table sheet that holds reportable information, and the row- and columnheaders characterising the Data Point can be regarded as the dimension and member combinations that apply to the Data Point.
DefaultMember A member in an enumerable dimension that will represent the dimension-member combination on a Data Point when that dimension is not explicitly associated
DictionaryElement An abstract term for dimensioned elements, dimensions, domains and members
Dimension A dimension represents the “by” condition, which identifies the qualitative conditions of a Data Point.
Note 1 to entry: Dimensions literally describe the dimensioned element in order to limit the range of interpretation and thereby qualify the dimensioned element. One dimension either has a definite (i.e., countable) number of members, which is called an explicit dimension, or an infinite number of members represented as values, that follow a specific typing pattern, which is known as a typed dimension.
DimensionedElement A dimensioned element shows the nature of the data by typing it. It holds information about the underlying structure of the cell that is specified. In IT contexts, a dimensioned element is referred to as metadata.
Domain A domain is a classification system to categorize items that share a common semantic identity.
Note 1 to entry: A Domain provides, therefore, an unambiguous collection of items in a value range. The items of a Domain can have a definite, and therefore countable, number of items, or an infinite number of elements that follow a specific (syntax) pattern.
DomainMember Each element that is part of a domain is called a domain member. Note 1 to entry: It is also possible to have members that do not belong to a domain; they can refer to a dimension directly. Note 2 to entry: Domain members can either be explicitly named or defined by a type.
EnumerableDimension An enumerable dimension is a dimension that “specifies a finite number of members
Fact A fact describes the quantitative aspects of data reported.
EXAMPLE An amount, a number, a string of text, a date.
Hierarchy Nesting (setting relationships in a parent-child like architecture) of dictionary elements
NonEnumerableDimension A non-enumerable dimension “specifies an undefined number of [members] [...] [it] defines syntactic constraints on the values of the members, i.e., a data type or a specific pattern.
Sub-Domain A sub-domain is a subset of the members of a domain.
Taxonomy A taxonomy describes a valid Data Point Model.
Templates Graphical representation of a set of supervisory data
What is a data model
General
Data models outline the relationships between data [Cf. Gartner (2012)]. It is important that the person responsible for modelling takes the time to capture all relations between data that can be shown in the model. It is essential that the model is reviewed by third parties involved for errors to be identified in advance. Furthermore, it helps to get a clearly structured model that can save time and costs later.
The term “model”
The term model has its origin in the Middle French noun “modelle” [Harper,D.(2013)]. In IT context, a model pictures a target-oriented system instead of directly intervening in the complex system [Cf. Ferstl, O./ Sinz,E. (2013), p. 22]. Specifically, in terms of data models, this means a real system, a system from the domain comprised of real components that are tangible and dynamic, which is mapped to a model to reduce complexity [Cf. ibidem, p. 20]. This may help to find a suitable solution to an existing problem. The model needs to be created as close to reality as possible, with attention to requirements regarding structure and behaviour. Nevertheless, in order to raise the comprehensibility, aspects irrelevant for the purpose of modelling may be left out. The importance of a single aspect, and whether it is worth being specified in the model, depends on the decision of the domain experts. This strongly depends on the modeller’s understanding, creativity and capability to associate the object system with the model.
The challenge of data modelling is that a data model “must be simple enough to communicate [it] to the end user [...] [and] [...] detailed enough for the database design to use it to create the physical structure“ [ZaZa Network (2007)]. The same principle applies to message design and its physical representation.
In the following paragraph, the procedure of data-oriented modelling is presented.
Data-oriented process of modelling
The data-oriented process focuses on describing the static structure of the reporting system, in contrast to the function-oriented process, which begins with modelling the functions of the reporting system and adds the data in a later stage.
As data is the focus point of the banking supervisors, the data-oriented process is applied. Additionally, in the course of time, data [objects] do not change as much as processes do. Functions are not being taken into account here.
Applying the data-oriented process, data objects are specified first, as well as the attributes that belong to each data object. The next step is to put the objects in relation to each other. Furthermore, the data model can imply integrity conditions and define operations that can be carried out on the data [Cf. Baeumle-Courth P../Nieland S./Schröder H. (2004), p.56].
The conceptual data model as a first step aiming for a database system
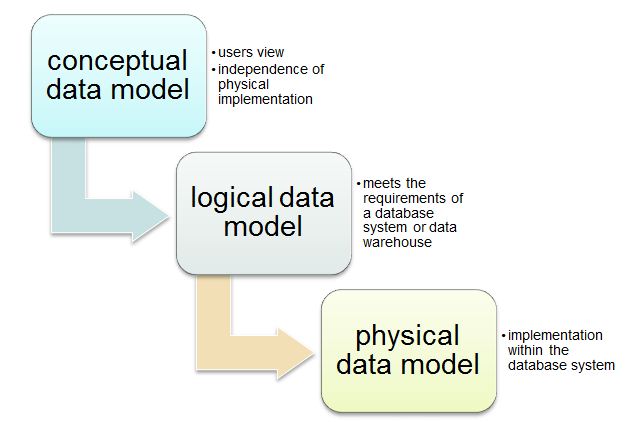
The data-oriented modelling takes place on 3 different levels that are built upon one another.
- Figure 1 - Levels of data-oriented modelling.jpg
The conceptual data model reflects your reporting requirements. You are in the best position to know what pieces of information are requested. The conceptual model helps you in the communication with your IT specialists. This is an important step to avoid unpleasant surprises later when the model is implemented in the IT department. The model is built regardless of the database system or data warehouse to be used [Cf. 1keydata (2013a)]. Relevant facts of the object system are to be specified without loss of information. However, you, as the creators of the conceptual model do not need to be technically skilled because the succeeding steps of data modelling are carried out by IT specialists. They should be concerned about the technical requirements. It is very important that this first step of preparing the conceptual data model is carefully elaborated before transferring the information to the IT. This can be ensured by early reviews, which include all parties concerned.
The logical data model, as well as the physical data model, is prepared by the IT specialists. In essence, the logical data model immediately follows the conceptual model (see Figure 1). When aimed at a database approach, in contrast to the conceptual model, it also takes the requirements of the database or the data warehouse into account [Cf. 1keydata (2013b)]. The physical data model, as a final step, describes the actual implementation into an existing database system [Cf. 1keydata (2013c)].
Description of data modelling approaches for supervisory purposes
Introduction
This paragraph deals with the methods that are used to disseminate data and identify all of its appropriate aspects. The two most appropriate methods of expressing regulatory data in a structure to determine the context of the information will be discussed here. Both modelling approaches refer to metadata.
Definitions for data and metadata are given below:
Data is “information processed or stored by a computer. This information may be in the form of text documents, images, audio clips, software programs, or other types of data. Computer data may be processed by the computer's CPU and is stored in files and folders on the computer's hard disk.” [TechTerms (2013a)]
Metadata “describes data. It provides information about a certain item's content.“ [TechTerms (2013b)]
While data is a number like “50”, the metadata adds qualifying information to the number. The explanation on the “form centric” and the “data centric” modelling approaches will clarify the difference.
Using the “form centric” modelling approach
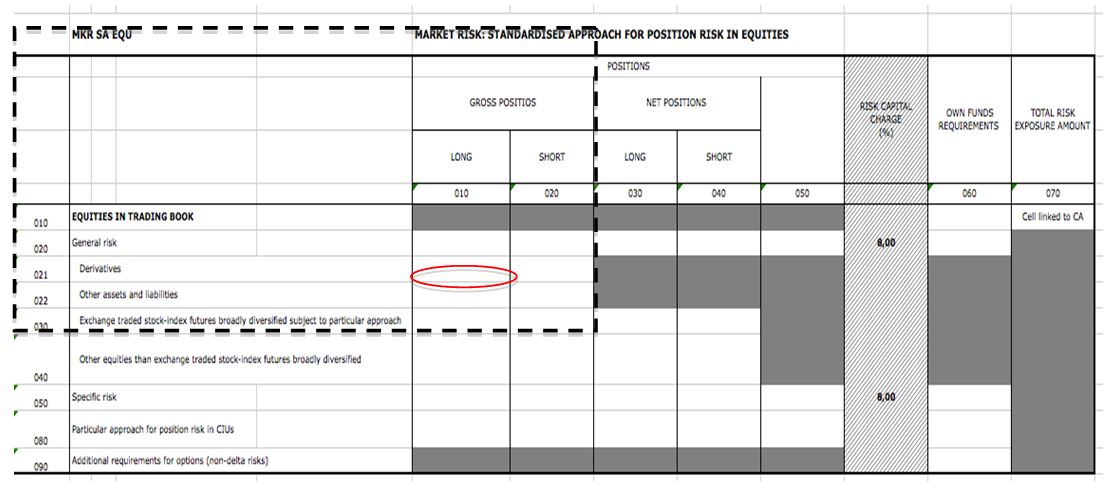
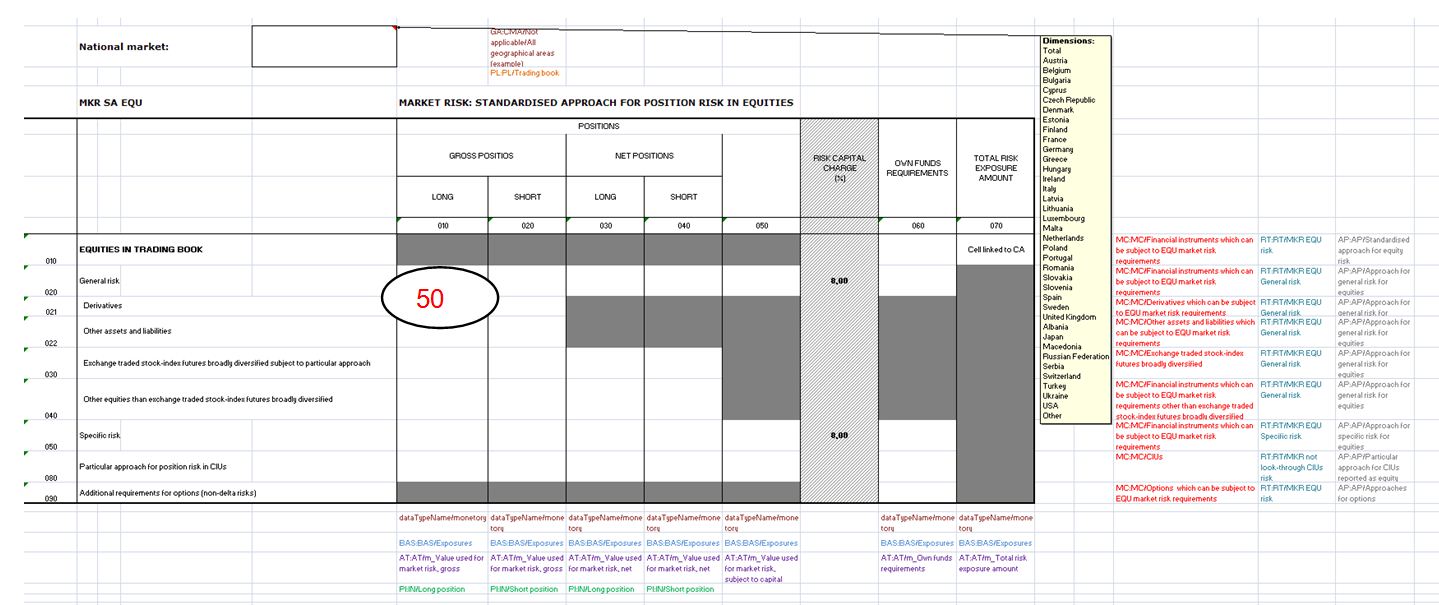
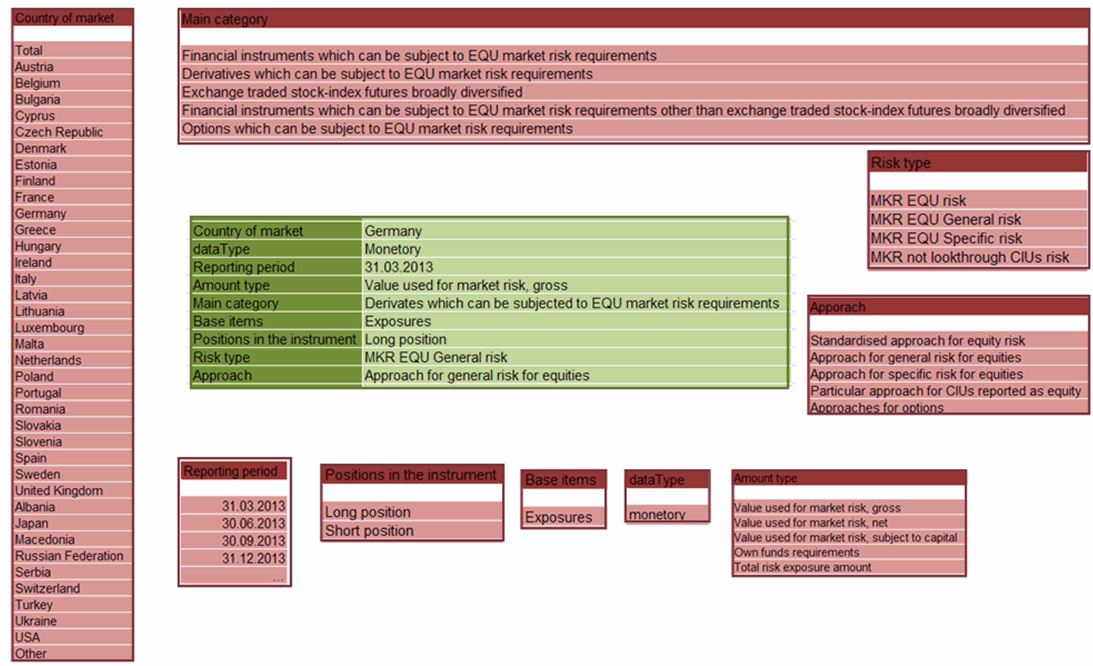
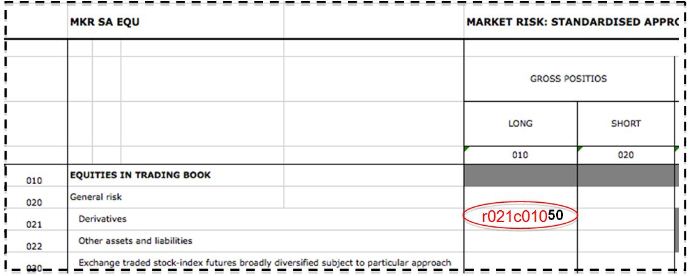
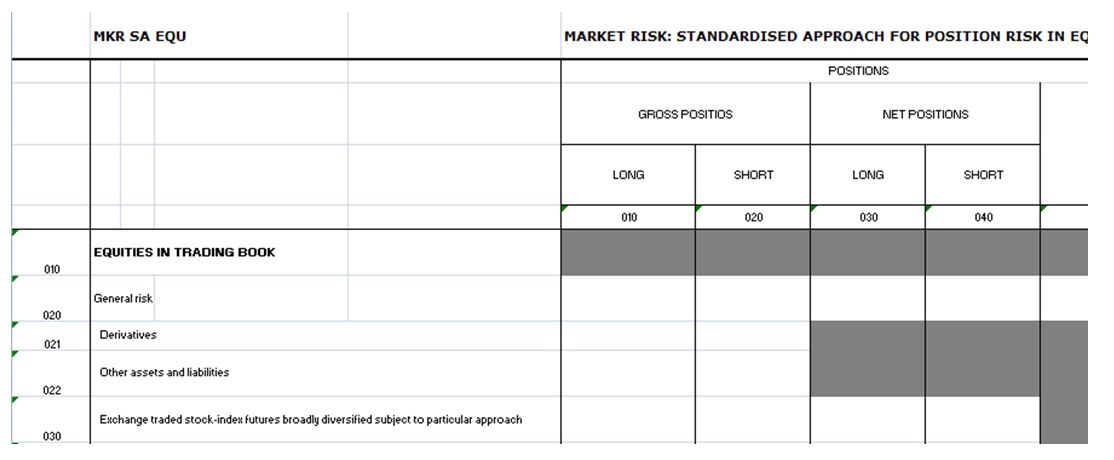
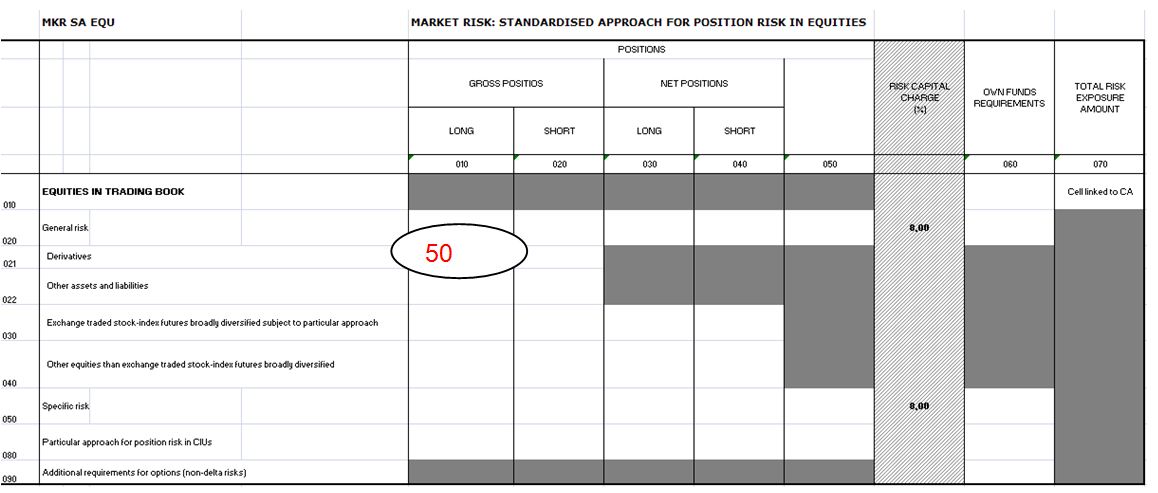
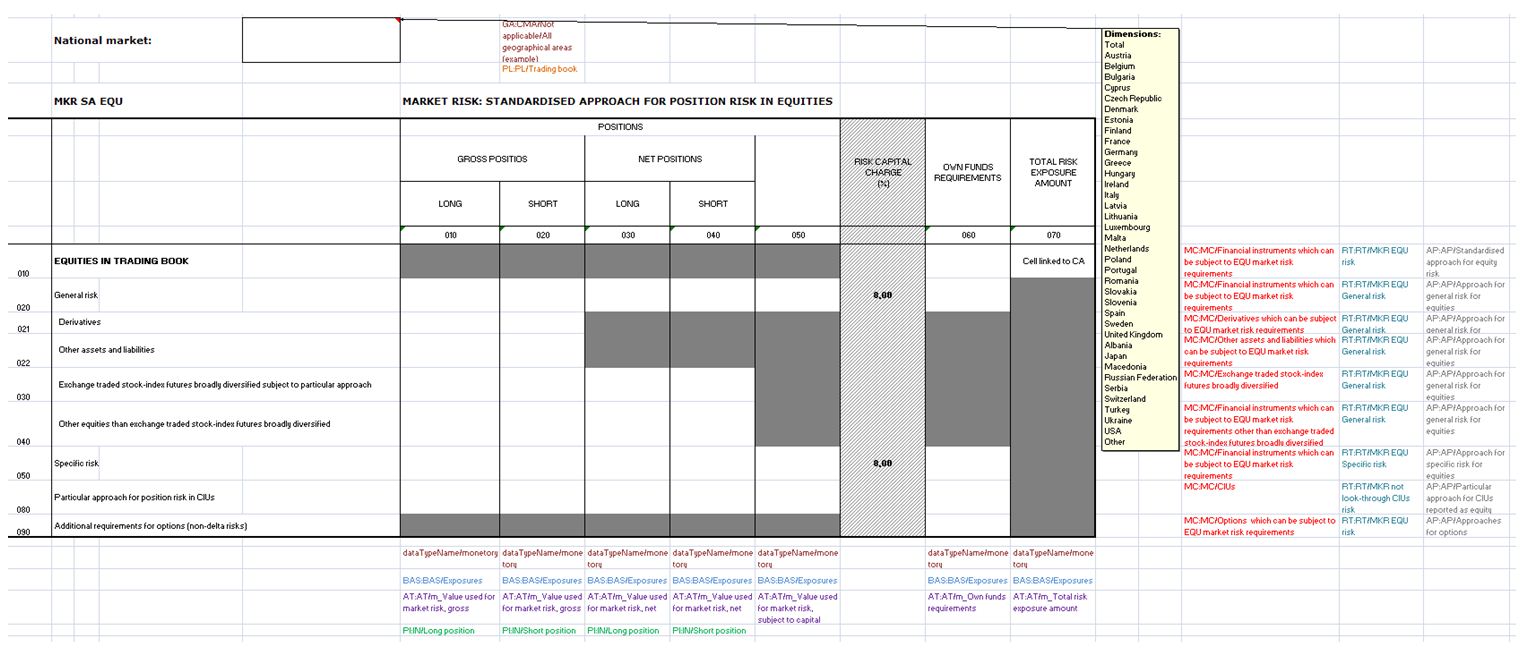
The “form centric” approach is an ordinary table format with information held in a cell of a predefined table called a template. Here a template is understood as a graphical representation of a set of supervisory data. This approach identifies reporting data by their position in the templates. In this case, each datum is defined by its coordinate in the table that is represented by the combination of columns and rows of a template. Each coordinate has a code that is based on the row code and the column code. This means that the data reported on the basis of coordinate codes is meaningless without the context of the template. In the following example, each cell that represents a data requirement is described by a code combination of its column and its row of the table Market Risk: Standardised form for position risk in equities (MKR SA EQU) of the COREP framework. The form represents market risk equity positions of the institutions that are subject to mandatory reporting. Throughout the whole document, this table serves as an example to introduce terms and concepts of Data Point modelling to you. The table with annotations can be found in the appendix in full size in order to deliver better clarity.
- Figure 2 — Table MKR SA EQU as an example of a form centric approach [EBA (2013)]
The “form centric” approach is oriented as the visualization of the data. Dependencies between the codes of the data are only shown in the templates, i.e., by identifying the appropriate headlines or by the indents of the label rows. A report based on the “form centric” approach, which uses codes for the identification of data, is not able to incorporate the dependencies visibly.
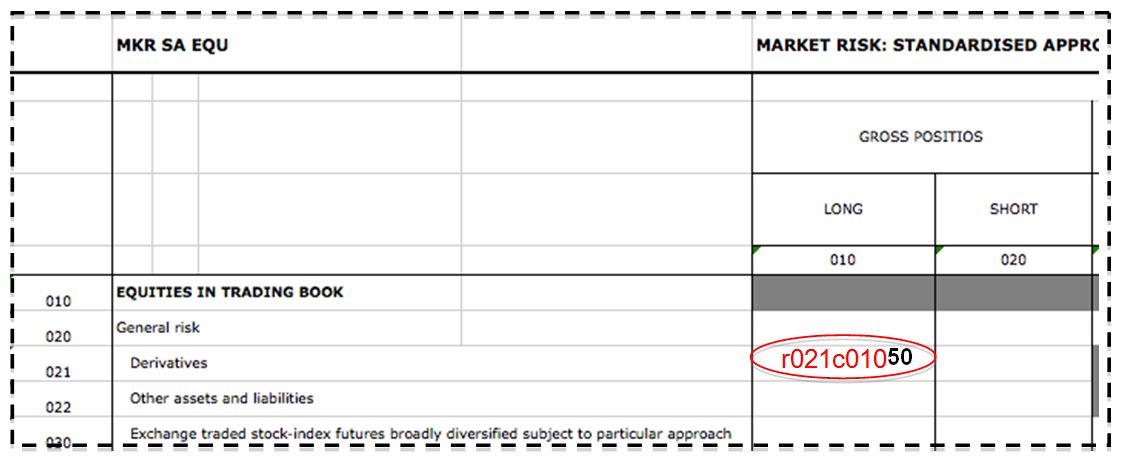
- Figure 3 — Close up of table MKR SA EQU for higher visibility on important aspects
On the basis of the section of sample table MKR SA EQU, shown in Figure 3, the “form centric” approach is explained. The value reported by the monetary institution in each cell is called a fact. Facts are classified as data. Let us say that the oval circled cell, defined by the row position r021 and the column position c010, holds the monetary value “50”. The coordinate code r021c010 in the red circle is the combination of the row position followed by the column position. Taking the template into account, we realise the number “50” represents a value for derivatives as a gross position. When we include additionally the headline above column c010 we can conclude that a long-term position is reported.
Looking at the excerpt, it is not specified to which year this information belongs. Neither do we know whether “50” represents a value in thousands or millions, nor can we conclude its currency. We can imagine that it would be really hard for a non-supervisor to correctly classify this information 50. Now, if you think about the table shown in Figure 3 again, what would that number tell you if you did not have any headlines labelling the rows and the columns? Obviously, the information would be useless.
In conclusion, we see that the “form centric” approach doesn’t include information about the data reported, which is assumed to be known (like all figures are in thousands). Moreover, without the context of the row and column position of the datum, the information content is essentially zero.
Using the “data centric” modelling approach
In the “data centric” approach, data is identified by a set of characteristics. It is considered independently of its graphical representation by adding information that unambiguously defines the datum. Therefore, no positional alignment is needed in order to give the datum a specific meaning. Any datum is expressed in terms of the categories necessary for their identification.
Information available is divided into two groups:
- qualifying information;
- quantifying information [Cf. Sapia, C. / et al (1999)].
Qualifying information is represented by attributes to certain categories, while quantifying information describes the object evaluated.
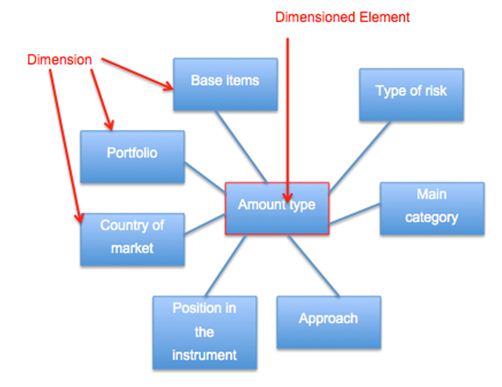
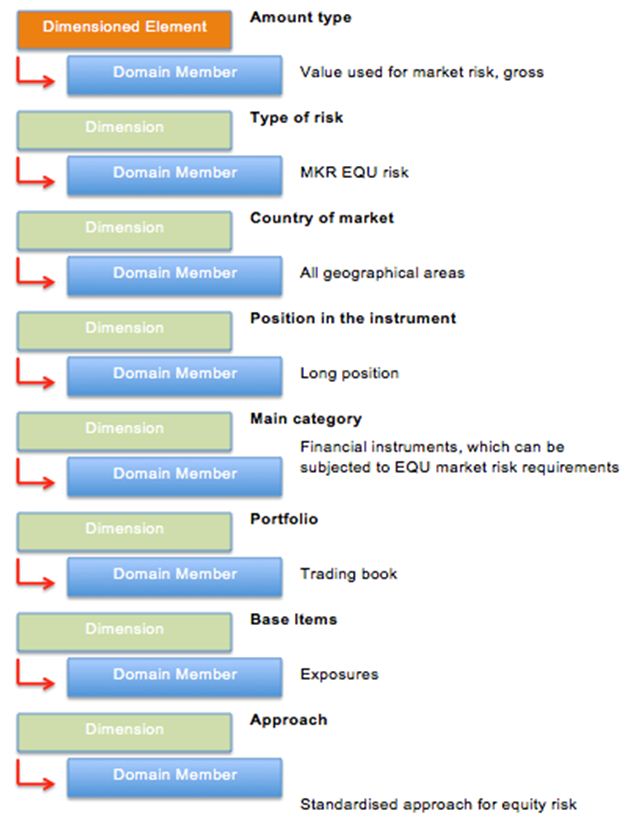
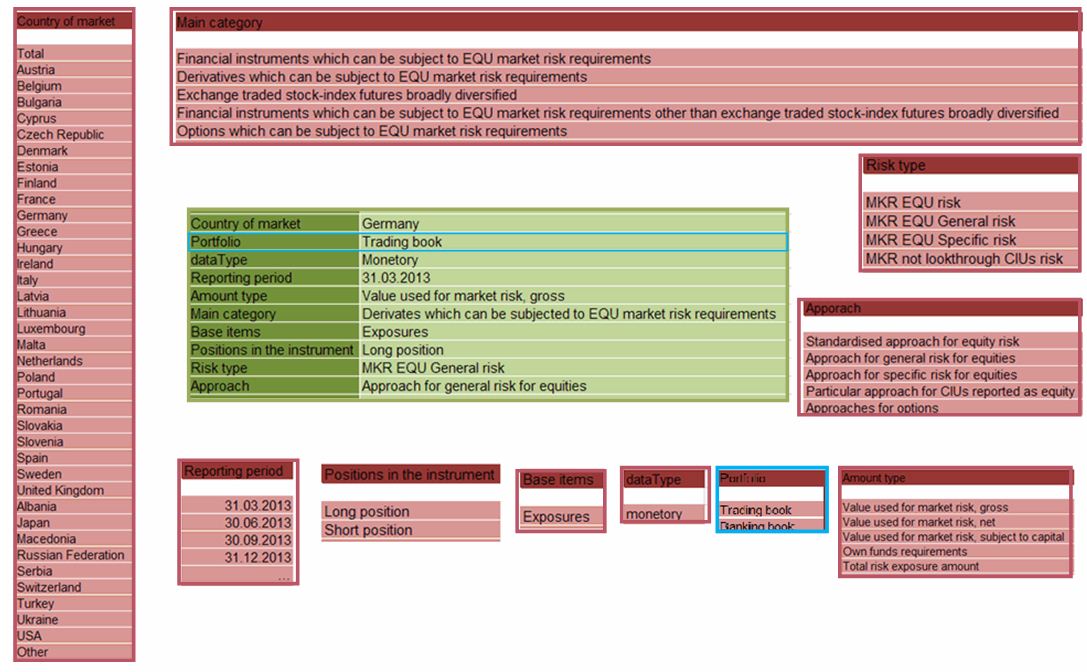
Figure 4 shows a dimensioned element which holds the information about the main character of the datum to be reported. A dimensioned element shows the nature of the data. It holds information about the underlying structure of the cell that is specified. In IT contexts, a dimensioned element is referred to as metadata. In our example, the dimensioned element specifies the amount type of the datum as a gross value. The corresponding categories, called dimensions, contain further information on the datum and therefore increase the quality of the datum to be reported. The dimensioned element, as well as the dimensions, belongs to the group of qualifying information, i.e., metadata. The number itself, “50” in our example, is called a fact and represents the quantifying information of the datum.
- Figure 4 — Dimensional model for MKR SA EQU
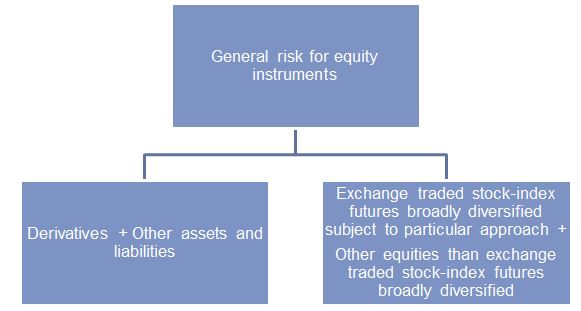
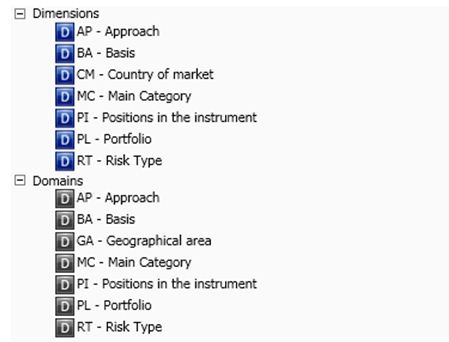
One Data Point is represented by one cell of the table in the “form centric” approach. Going back to the example above used to explain the “form centric” approach, defining the cell by a combination of row and column codes (like r021c010), we have got a Data Point specified by a dimensioned element with its corresponding dimensions indicating the various regions. One possible dimension, for example, that can be derived looking at the table in Figure 2 is the risk type dimension. Various types of risk are listed in the rows of this table: “general risk” and “specific risk” are reasonable attributes for the risk type dimension. To identify the risk types, business knowledge is needed. We cannot rely on the nesting (tabs) in the table as they might be used differently amongst table creators for presentation purposes. Each dimensioned element is characterised by a variable number of dimensions. Each dimension is linked to one attribute, called a member, to characterise the Data Point. The dimensions represent the “by” conditions. Dimensions literally describe the dimensioned elements in order to limit the range of interpretation, and thereby qualify a dimensioned element. One dimension either has a definite (i.e. countable) number of elements, which is called an enumerable dimension, or an unknown list of members to the regulator, which is called a non enumerable dimension [Cf. Declerck, T./ Hommes, R./ Heinze, K. (2013)].
Members are attributes that can be assigned to a dimension. As members are often used for various dimensions, domains are introduced in order to reduce redundancy. Each domain contains semantically correlated members that can be used throughout the whole of the reporting framework. The dimension represents the semantic relevance for the specific use on the dimensioned element. All members are added to at least one domain that can be reused by a variety of dimensions.
Returning to the difference between metadata and data, the definitions are transferred to the vivid example of MKR SA EQU. The Data Point identified by the row and column code combination r021c010 in the table format holding a fact “50”can be referred to as data. The metadata is described by the dimensioned element specifying “50” to be a gross value and the selected domains, one for each applied dimension.
It should be ensured that each Data Point is defined only once in a reporting framework, regardless of whether it is included in more than one table. One major benefit is that the information can be assembled in various ways, based on the preference of the supervisory expert. Therefore, the form of the tables can be aligned with the previously used “form centric” tables. This results in a minimum adaptation time for the filers.
Description of dimensional modelling
Dimensional modelling is the innovative modelling type to create multidimensional data models. Depending on the conditions, the dimensional model may be “simpler, more expressive, and easier to understand” [Ballard, C./et al (1998), p. 42] than divergent modelling techniques. Dimensional modelling is used by the data centric approach, introducing dimensions to qualify the information that consists of numeric data, including values, counts, weights, balances and occurrences. The main information about the datum, i.e., the data type of the fact, is held in the dimensioned element, which is verified here by the amount type dimension as it contains crucial information about the Data Point to be specified. Further qualifying information that is associated with the Data Point is specified by the members of the applied dimensions [Cf. Ballard, C./et al (1998), p. 42].
- Figure 5 — Example of a dimensioned element with corresponding dimensions for the cell r021c010 marked in MKR SA EQU
The term ‘metrics’ is used as a synonym for ‘dimensioned element’ in other sources [Declerck, T./ Hommes, R./ Heinze, K. (2013)]. However, for the rest of this paper the term dimensioned element is used. Taken literally, it is the one that is defined by the application of dimension-member combinations.
The concept of normalisation
As previously stated, redundancy is to be reduced by the use of the Data Point Model. The most popular approach to achieve this is through the process of normalisation. As this is an IT specific proven concept, it will be introduced to you in this paragraph. Figure 6 shows what a typical table created by business users looks like. The values are reported in order to store them in a database and carry out an analysis.
- Figure 6 — Table MKR SA EQU created by business users
Examining the table, many questions remain unanswered for the untrained reader. Here is a list of questions that shall serve as some guidelines:
- Unit of measure: What does “50” mean? Units? Currencies?
- Reporting entity: Are the values of a single country or institution?
- Definition of the used members: What is considered as derivatives?
- ...
This set of questions was developed in a very short time. It is obvious that it is important for the reporting entity and the supervisor to share the same vision. In order to avoid discrepancies in the interpretation of the figures, the table must be unambiguous.
In order to leave no room for doubt, the questions above need to be answered. The information held in the figures of this table must be made explicit to all users on both ends of the communication process.
Another way to express the same facts, in order to answer some of the questions raised, is in plain text, as follows:
The cell r021c010 of MKR SA EQU holds the following information, which is obvious to you as a banking supervisor:
50,000 € worth of derivatives were held by a certain institution at a certain date.
All the cells in the table are reported by one institution, and each Data Point in that table is to be sent for one reporting date.
It is obvious in this method of representation that all facts stored in the example table MKR SA EQU are - of monetary value; - in one common currency; - reported in thousands.
It is still not yet known who reported the figures. Furthermore, there is no definition of the axes´ members. The members that add qualified information about a single value need to be specified in order to prevent discrepancies in the interpretation of readers. The task now is to check what level of detail is required for the facts reported, in order to carry out the required analysis at a later stage. On the basis of this decision, abstract categories are created. It is advised to carry out this task in a team of experts.
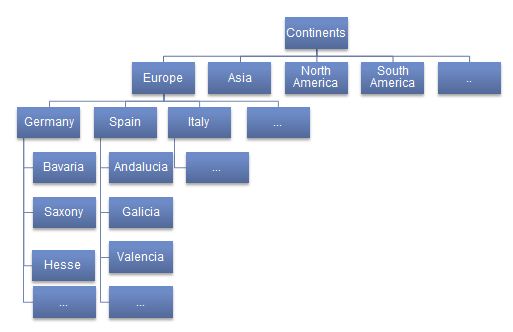
For example, if we want to analyse the credit risks taken, it might be important not only to obtain knowledge about the countries where the risk was taken, but also about the different regions within the countries because this might reveal a difference in the risk aversion within the various regions (Figure 7). Therefore, it is not sufficient to name a category “country” and list below all countries. Referring to the mentioned example, a further breakdown is needed that lists the regions of each country. For these different levels of detail, a hierarchy can be defined in order to derive aggregated information about one country, or one continent at a later time [Santos I, Castro E (2011)]. A sample breakdown with selected continents, countries and regions is shown below.
- Figure 7 — Hierarchy of countries to show different levels of detail
The country category is just an example to make you aware of the level of abstraction you may choose for the categories identified.
A list of the identified categories of the facts reported in the table above (Figure 6) follows: - A monetary value: some numeric data type. - In a currency: closed list of currencies allowed. - In thousands: closed list of precision types allowed. - A reporting period or a point in time: A closed list of periods, as all reports are required to cover predetermined periods. - If the figure was reported by a single bank, a closed list of all banks that report to the national supervisor may be a good way to categorise the fact. - An explanatory document of the axes´ members is needed as a reference, where each member of each dimension applicable for MKR SA EQU is unambiguously defined.
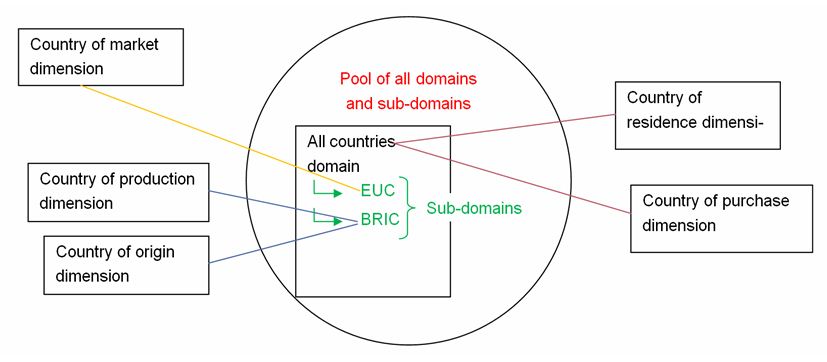
Each member must be created only once and allocated to one domain. The members must be created in a consistent manner, and without doubling the same elements under different labels. The domains can be assigned to dimensions. Suppose that we created the full hierarchy as is visualised in Figure 7. We could assign a (sub)domain called 'European countries' to a dimension named 'country of market'. In this domain all the European countries would be listed. Also, there could be another (sub)domain called 'BRIC' containing the countries Brazil, Russia, China and India. This BRIC (sub)domain could be assigned to two dimensions, the 'country of origin' dimension and the 'country of production' dimension. Last but not least, we could build another domain called 'all countries' where all the members that are already assigned to other (sub)domains, as well as remaining countries, are included. This domain can, once again, be assigned to multiple dimensions. Figure 8 represents this scenario:
- Figure 8 — Pool of shared domains
Once domains are created, they can be assigned to a variety of dimensions. That prevents redundancy of members and defines them uniquely for satisfying the requirements of communication via computers. This step is called normalisation. A technical definition for normalisation is as follows:
Normalisation is the transfer of a data model to a certain state. The various states are differentiated by levels of the 'normal form' and achieved by applying them to the data model. The third normal form is enough to prevent redundancies and inconsistencies. Therefore, the maintenance of stored data is facilitated by applying the third normal form [Cf. Minhorst, A. (2005), p. 49].
To achieve this, the two main aims are: - arranging data into logical groups, such that each group describes a small part of the whole [databasedev (2013)]; - restricting to the level of detail needed [Heinze, K. (2013)].
In order to bring your data model into the third normalised form, you need to group members in domains and make sure that the domains do not overlap. It must be possible to unambiguously assign the members to a single domain. Therefore it is important to use meaningful names for members, domains and dimensions. It is also advised to prepare a handbook where the names are differentiated. Following these rules, consistency throughout the model can be achieved.
Why use a multidimensional data model
Introduction
The data in the conceptual model can be modelled dimensionally as well as hierarchically [Collins, J. (2013)]. The reason it is advised to create a multidimensional data model, is that it is closer to the presentation form that the user is accustomed to, and therefore easier for him to understand.
Multidimensional data model
The multidimensional data model supports the “data centric” approach with its two groups: qualifying and quantifying data.
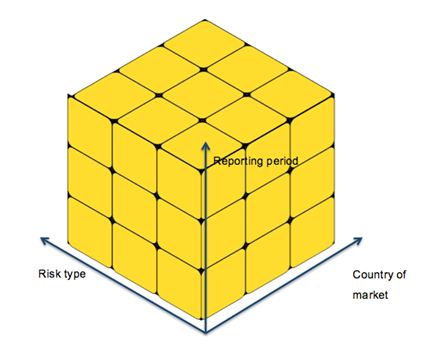
In order to make it clear, we will continue with the example of MKR SA EQU that you are already familiar with. We simplify the model in Figure 9 to show three categories by displaying it on paper.
- Figure 9 — Multidimensional model
The multidimensional data model visualised by a cube is specified by three categories: risk type, reporting period and country of market. These categories are referred to as dimensions and, as stated before, serve as examples for qualifying information. The single cells that make up the cube carry quantifying information. Most of the time Data Points hold values that can be summed upon demand.
The dimensions risk type, reporting period and country of market that show a semantic relationship between them are used to specify an orthogonal [meeting at a right angle] structure to the data space.
It is possible to carry out arithmetic operations on the numeric values in each cell.
Two major advantages with this modelling technique are: - first, the collected figures are each represented once in the model, and - second, the ratios on a higher level of aggregation can be computed by means of the existing values.
Operations that can be carried out on a multidimensional data model
It is possible to create individual views on the present extensive multidimensional data model. One approach is to look at slices of the large whole. This is often visualised by referring to a single selected domain of one of the dimensions, and, therefore, receiving figuratively a slice of the cube. Actually, one might say that one dimension is not taken into account with this view of the cube [Cf. Verma, R. (2009a)].
- Figure 10 — Slicing visualised
Referring to the example cube shown in Figure 10, we focus on the orange highlighted part. By slicing, we get all reported risk types of all countries of market at a certain reporting period. Whether the reporting period situated on this dimension is a domain describing days, months, quarters of the year, or even whole years, remains to be seen.
With dicing, in contrast to slicing, all dimensions remain considered. The process of dicing figuratively cuts a hexahedron out of the big cube. Adhering to the same example, Figure 11 pictures the effect of dicing. According to the model cube, one attribute on the reporting period dimension is excluded for the analysis. Therefore, dicing results in a new hexahedron that is smaller than the original cube [Cf. Verma, R. (2009b)].
- Figure 11 — Dicing visualised
Figure 11 represents the idea of looking at the more recent reporting periods, leaving out the figures of reporting periods from further in the past. As the exemplary Figure 11 is much larger in reality, it is also representative of analyses that are carried out to compare the figures for a given period of years, like certain decades. The difference from slicing is visualised in Figure 11. By having multiple attributes of each dimension coloured in orange, the dicing process takes multiple characteristics of all dimensions into consideration.
Why data modelling is essential for collecting supervisory information
Introduction
The massive amount of information reported, and the request to analyse this data in many different ways, appears to be problematic if the data is not structured in any way. A new type of data modelling was introduced by the Eurofiling Initiative called Data Point modelling. It is meant to combine the advantages of the various data modelling types as they relate to supervisory reporting. Data modelling is essential for all participants as it enables the communication of clear and unambiguous definition of terms used in the reporting framework.
Objective of Data Point modelling
The Eurofiling Initiative is about to set a syntax standard for collecting information for supervisory and statistical reporting. The aim is to benefit from international solutions instead of proprietary ones. For example, validation software for data received, mapping software for transforming the collected data into databases, and rendering software to make the exchanged data visible to parties that are not directly involved in the communication process, like accountants and actuaries. The data format to which a DPM can be transferred later is variable. At present, the preferred standard syntax is a format called Extensible Business Reporting Language (XBRL).[Cf. Piechocki, M. (2012)] It was chosen because of its characteristics being adapted to the requirements of the financial sector. The use of XBRL does not imply an enforced standardisation of business reporting. On the contrary, the syntax is a flexible one which is intended to support all current aspects of reporting in different countries and industries. Its extensible nature means that it can be adjusted to meet particular business requirements, even at the individual organization level.
Moreover, the EBA has given signals that XBRL will be the format that it will require to receive the data collected by national authorities [Cf. EBA (2011a)].
The four main reasons for modelling Data Points (whether using XBRL or not remains to be seen) are illustrated in the following paragraphs.
The DPM is a multidimensional model. As an example, the figure below represents the cell r021c010 of Figure 12 of the table MKR SA EQU.
The dimensions are coloured in dark red. The members of the domains that are assigned to the dimensions are coloured in light red. The applicable domain members for each of the dimensions are made visible in the centre of the figure in green colours.
- Figure 12 — Example of Data Point Model visualised
Main features
Increase of knowledge and understanding
As the Data Point Model is built by you, the supervising experts, it is assured that the know-how is transferred in a data model that shows the data required in the appropriate detail. In order to create a sustainable system, it is important to gather not only the information needed at present, but also all details of the collected data that can be identified and that might be important in the future. Using the concept of Data Point methodology ensures that the data is arranged in a comprehensible way by the supervisory department. It is not only the data that business specialists are most familiar with. Understanding the relationships within the information is another reason for the transfer of the task of building a Data Point Model to you, as supervisory experts. The creation of the Data Point Model underpins the already existing knowledge held by you, and makes the transformation of the information to the IT specialists possible.
Improvement of integration of changes
With a well-designed Data Point Model, it can be ensured that the data structure is defined explicitly and without redundancies. This means that no single fact is described in two different ways. Therefore, every single piece of information is unique. If more information is required, qualifying aspects may be added to the fact in conjunction with the construction of a new dimension, as needed. Figure 13 shows this case [Heinze,K. (2012), p. 79].
- Figure 13 — Extensibility of Data Point Model is shown by adding a portfolio-dimension
The portfolio dimension (framed a light blue) was added because requirements relating to the distinct trading book and banking book have to be applied. It is not difficult to add new dimensions when they are requested. This is very important for analysis by the data warehouse later, as well as slicing and dicing, which is explained in Section 3.3. The out-dated requests do not have to be modified. They are still showing the same results on an expanded Data Point Model. This makes integration of changes very easy.
Reduction of risk of duplicate information
This goal refers to the avoidance of duplicate information. With normalization on Modelling Data Points, dimensions and members can be reused. As explained in previous sections, it is advised to combine members in a domain, possibly also sub-domains, which can then be associated with a dimension. Hierarchies are defined as group sub-domains of already existing domains.
Most of the time, we can identify different levels of detail for members of one domain. This means that a kind of natural hierarchy is formed. You can represent these members of different levels of detail by sub-domains. We try to represent these relationships as hierarchies because this information can be reused for the definition of rules for calculations (total has individual facts). Hierarchical presentation and understanding how members are interrelated are further purposes of defining hierarchies. In hierarchical modelling, this is called a parent-child relationship, which is figuratively shown in Figure 14 [Cf. IBM (w.y)].
- Figure 14 — Shows the relations of the parent-child relationships with Germany in the focus
With Germany as an example for one country, we can identify each of the 16 German states, like Bavaria, Saxony and Hesse, as children of the country Germany. However, Germany can also take the place of a child if we add the continents to our context.
This means that one continent consists of several countries. Each single country may be composed of states. The advantage that can be derived from hierarchies is better explained by another explicit example. If we store the data at a level of detail that represents every state, the figures for country as well as continent can be computed. It is possible to aggregate the states of each country simultaneously. If required, we can also aggregate the countries of one continent in order to get the information on a continental basis.
As it is possible to compute the lower levels of detail from the higher levels of detail, it is advised to store the information at the highest level of detail available.
In order to build a Data Point Model which can be used and maintained in the future, hierarchies should be built. The information about the nesting of members in a hierarchy improves its understanding by humans, and helps to include any new supervising criteria. Another use for hierarchies is to express the possible mathematical relationships between members, if they are assigned to numerical dimensioned elements. A ‘total’ dimensioned element can be comprised from multiple 'detail' dimensioned elements, each representing a different member. The validation rules shown below (Figure 16) in the Excel file provide a basis for hierarchies to be defined.
- Figure 15 — Hierarchies of risk type domain depicted
Figure 15 shows a hierarchy for the risk type domain. Having the excerpt from an Excel file below, as well as the respective table MKR SA EQU with its row and column positions listed, we are able to derive a clearer view of the hierarchy of the members contained in the risk type dimension.
- Figure 16 — Validation rules for MKR SA EQU
Moreover, from the second and third row of the validation rules, depicted in Figure 16, we can derive further information about the composition of the general risk listed in row 020 of table MKR SA EQU. Combining the two images in Fig. 16, we can now state that General risk is the sum of "derivatives" and "other assets and liabilities".
When a new risk is to be reported, the decision to be made is whether the risk is at the top level, different from the equity risk, or below the equity risk member, and therefore at the same level as the four types of risks depicted above in Figure 15, further building up the equity risk. It is also possible that there is a change in regulation that requires splitting up one of the lower level risks.. According to this scenario, a third level of equity risks will be introduced, further breaking down one of the second level equity risks, like in the example visualised in Figure 17.
- Figure 17 — Further breakdowns for general risk for equity instruments
Furthermore, sub-domains can clarify relationships between members. A sub-domain is a subset of the domain containing a part of the whole. A sub-domain, just like a domain, can be assigned to a dimension. If we want to restrict the choice of members of a given domain to be assigned to a dimension, we can build a sub-domain containing selected members of the whole in order to reduce redundancy. One conceivable sub-domain for the country of market dimension can be labelled “European countries”, represented by the domain 'EUC', which is an acronym for the whole name. Its members would be all countries in the European Union. Spain, Portugal, Germany, as well as France and all other countries that belong to the European Union from a political point of view, would be members of this sub-domain. Other domain keys contain different countries or additional ones, or parts of those in the example. Any new (non-existent) combination of countries can be expressed by a new domain or sub-domain. However, there might be another dimension, like, for example, country of production. Logically, this dimension needs countries as members as well. It is possible to use any domain or sub-domain defined for any dimension. Figuratively, a pool of domains and sub-domains is created, which contains the domains and sub-domains to be chosen from for the specific dimension.
Higher harmonisation
Thanks to the use of both the “data centric” as well as the multidimensional approach, it is possible to carry out extensive queries in a data warehouse. The sharing of Data Points from various reporting frameworks, like COREP and FINREP, support the harmonisation process.
Based on the reporting frameworks COREP and FINREP, as well as some other smaller ones, common dimensions among these frameworks were identified to reach a higher degree of harmonisation by sharing dimensions and members across frameworks. Figure 18 shows the set of unions and intersections between common dimensions across the universe of European reporting frameworks.
- Figure 18 — Dovetail connection between different common reporting frameworks [EBA (2011b), p.50]
Classification of Data Point modelling in the data modelling concept
With the knowledge of data modelling gained in the previous sections, we are now able to describe the characteristics of a Data Point Model. The concept of Data Point modelling is based on the “data centric” approach described in Section 2.5.3. This data structure facilitates the understanding by business experts who are responsible for the creation of the Data Point Models. The “data centric” approach has further advantages, such as the gain in uncomplicated extensibility and the reduction of risk of duplicate information, which add support for the data centric design.
Without doubt, supervisory reporting focuses on the data collected from the monetary institutions that are required to report.
The modelling of Data Points is part of the creation of the conceptual data model. The logical data model and the physical data model rely on a well-designed Data Point Model in the conceptual modelling stage. This is visualised above in Figure 1. Therefore, the DPM is to be created, well thought out, and reviewed by interested parties.
A greatly simplified view of the Data Point, representing the cell r021c010 of MKR SA EQU with only 3 associated dimensions, is visualised in the following Figure 19. Possible combinations of members of the three chosen dimensions (country of market, risk type and reporting period) are simplified in Figure 9 below.
- Figure 19 — Shows Data Point and three applicable dimensions
- country of market, risk type and reporting period
A Data Point is a combination of dimensions, with each dimension pointing to one of its domain members. In a table, a Data Point is represented by a cell. For example, we can understand the MKR EQU General risk taken by all monetary institutions belonging to the German market, in the reporting period reported by 30th of March 2013. Information can be filtered in many ways. Also, the information about any other risk type applicable for the table MKR SA EQU that was taken by the German monetary institutions in the reporting period of the 30th of March 2013, is available to us. Moreover, we can find out the risk aversion for the different risk types of each countries´ monetary institutions by the reporting period of 30th of March. According to this scheme, the information is clearly identified and therefore leaves less room for interpretation.
Area of application
The advantages of Data Point Models for supervisory reporting are especially appreciated due to the visualisation of reporting data in different views by using pivot tables. The tables can be aggregated, which allows compressed analysis.
- Figure 20 — Excerpt from the reporting table MKR SA EQU
In most cases, a fact is a numeric value accompanied by dimensional properties in the form of dimension member combinations. The assignment of a Data Point to a cell may not be allowed. The cells coloured in dark grey show this case. For instance, when a Data Point would not make sense, because the type of content does not exist in reality, the cell is greyed out. Another reason for the regulator not to allow reporting values for cells and, therefore, grey them out, is if the regulator is just not interested in the value or is unable to aggregate it.
The views enabled by pivot tables omit unnecessary detailed information for the analysis. The very detailed facts are aggregated in order to provide an overview for the user. Nevertheless, the numbers represented in the table are of high quality because the facts that are reported are broken down into their smallest possible units, and can be aggregated subsequently, if desired. Moreover, the data and its metadata reported are in machine readable form, which has the advantage of gathering the data only once.
What are the technical constraints
Attention should be paid to some rules that are listed below. The source of these constraints is a Wiki that started off as a joint venture of XBRL Spain and the University of Bucaramanga [Cf. XBRL Spain (2012)]. , the aim of which is to develop a standard that is adopted by all parties, and anyone interested is welcome to contribute ideas to the wiki. Amendments and additions to the content of the wiki are still possible and, therefore, the rules listed below are not final. It is assumed that additional constraints will evolve in the future, as more and more people determine points of contact relating to the concepts of Data Point modelling and XBRL. It is strongly recommended that you follow these rules, as well as those in the wiki.
For the DPM, there are a couple of important constraints in connection with hierarchies:
1) All members must be part of some hierarchy built by a domain and its members
2) Any single member can only appear once in any single hierarchy.
3) The hierarchy is built upon rules that are defined in a set of hierarchy relationships.
4) Each hierarchy has to be built from exactly one root element [Cf. Declerck, T./ Hommes, R./ Heinze, K. (2013)].
Moreover, when using XBRL, additional rules to those defined for the DPM must be considered., especially working with domains:
5) Each member has to be referenced by a domain.
6) For each domain, one member is set as a default.
7) One dimension has to point to at least one domain or sub-domain.
8) Each member must be unique [Cf. ibidem].
The most current and complete list of all constraints can be found at the wiki, which is “regularly updated with the help of the Eurofiling Initiative and XBRL Spain” [XBRL Spain (2012)]. The filing rules in particular are updated by a CEN (European Committee for Standardisation) workshop [Cf. CEN (2009)].
How do you proceed in creating a Data Point Model
Introduction
As it is likely that the reporting requirements will increase in the future, the Data Point Model has to be extended frequently. This section gives you an understanding of an iterative process for modelling a Data Point Model for a delimited supervisory reporting area, mostly represented by one or more templates.
The process flowchart is pictured below in Figure 21.
- Figure 21 — Process of creating a Data Point Model
Your objective is to transfer the reporting data into the data model with regard to new analysis capabilities. An IT expert may contribute to the normalisation of tables, and might carry out the quality assurance of the data model because he needs a complete and consistent data model in order to derive the taxonomy from it.
Moreover, data modellers must have the knowledge of how to create DPMs. We will use an example again to explain the essential process.
Define dictionary elements
First of all, we need to define dimensioned elements, dimensions, as well as domains and their members. They form the dictionary elements of the model.
We start off with one business template. As we are already familiar with MKR SA EQU, we will stay with this template in Figure 22.
- Figure 22 — MKR SA EQU template
Distinction between quantitative and qualitative aspects
Having chosen a template, we have to distinguish between quantitative and qualitative aspects for each Data Point.
Quantitative are the figures reported, like “50” for the cell identified by the row label “derivatives” and the column “gross positions; long” (r021c010). We could also say the data, as defined in Section 2.5, belongs to the quantitative aspects.
Qualitative aspects are pieces of information given in order to clarify the datum reported. Characteristics that explain the datum belong to this information, which are also called metadata.
Summary of quantitative aspects
The measurement of the dimensioned element needs to be added. There are two different types of time to be distinguished: “stock” and “flow”. Flows, in contrast to stocks, represent durations, i.e., measures reported for a period like cash flows, revenue and costs. Stocks are, for example, assets and liabilities representing an instant for stocks. Therefore the measurement is of a certain date.
The quantitative aspects in this template have the property of stock values, as the numbers represent the market risk at a certain date.
Classification of the qualitative aspects in categories
At this point, we figure out the domains by which the data can be grouped. We have, for example, different risk types which categorise the data: General risk for equity instruments, specific risk for equity instruments, market risk not look-through CIUs risk, and non-delta risk are the risk types that can be identified in the table.
Creation of domains
In order to prevent redundancies, domains are created. Members that share the same semantic aspect are assigned to a domain, and express this aspect.
The different risk types can be assigned to one common domain, as they consist of the same semantic identity. We call the domain “risk types for market risks for equity instruments” in order to give it a meaningful name. Moreover, a domain that includes all countries should be created. To facilitate recognition, we call the domain containing all the countries “all countries”. The domains can be directly and indirectly derived from the template. As banking supervisors, a lot of information is obvious to you. However, the topic of defining domains is important. One further example is given by using Euros for identifying the currency of the figures. We may also add US-Dollars, Pound and names for other currencies that may be applicable, and add them to a domain named “all currencies”. We could also introduce a domain that holds information about the multiplier that is related to the figure. We see that most of the information can only come from supervisory experts, especially those pieces of information that are not explicitly given in the template. This step is successfully completed for the Data Points once all members are described as part of the domain in a template.
Definition of dimensions
The next step is to define dimensions that refer to at least one domain. They provide a specific meaning for a domain when linked to a Data Point. A domain member and its corresponding dimension form one qualitative aspect of a Data Point.
The dimension for our MKR SA EQU template that refers to the “all countries” domain is called “country of market”. We give the dimension for risk types the same name as given to the domain. Finally, we want all domains applicable to the MKR SA EQU template to refer to one dimension.
Definition of a default member for each explicit domain
For explicit dimensions (dimensions that have a closed list of members), a default member must be defined. The default member is implicitly applied when a dimension is not explicitly associated with a Data Point. This is the case when a Data Point that has a dimensional context of 9 dimensions, but only 6 dimensions are explicitly associated with corresponding members, so that the three additional dimensions are implicitly included with their members that have been set as a default.
Specify hierarchies
The next step is the specification of hierarchies regarding a set of members, as well as the definition of calculation rules and concepts for presentation purposes.
Definition of hierarchies between domain members
The connection between domain members must be specified by building hierarchical relationships. Three types of hierarchies are expected:
- parent-child relationships for presentational purposes (presentation relationship) - summation-item relationships for aggregation purposes (rule relationship), and - domain member relationships that explain the semantics amongst members (basic relationship).
These can all be added in later stages.
Now, the difference between risk types of the lower level of detail, and risk types of the higher level of detail is established. As shown in Figure 16, the members of the “risk types” dimension can be formed in a hierarchy, based on supervisory knowledge, in order to allow the aggregation of members for “general risk” or even “equity risk”. Furthermore, in this step of the DPM creation process, the sub-domains are defined. A good example is the “all countries” domain, which was previously introduced in Section 3.7 (see Figure 8),. Sub-domains are the EUR sub-domain containing all European countries, as well as the Africa sub-domain that includes Northern Africa, Western Africa, Central Africa, Eastern Africa and South Africa.
Define Data Points
The third step is the creation of Data Points by building relationships between one dimensioned element and its associated dimensions.
In our case, the dimensioned element is based on the dimension amount type. For our sample, in cell r021c010 the dimensioned element specifies a “value used for market risk, gross”. The applicable dimensions of the Data Point pictured in Figure 23 are as follows: type of risk, country of market, position in the instrument, main category, portfolio, base items and approach. When a Data Point is reported as fact, it holds additional information about the reporting entity and the period type. Also, when the fact is numeric, information about the unit, the decimals or precision are held. When the fact is string based, the language is known. The identifier is a string of characters representing one reporting entity. The reporting entity is represented by an identifier. The period type gives information about the validity of the value reported. Depending on their temporal characteristics, data are reported for a specific point in time, or for a period in time.
Define normalised tables and ensure quality of Data Point Model
The fourth and the fifth steps are carried out with the help of the publisher of the taxonomy.
- Figure 23 — Annotated template MKR SA EQU
The task now is to define normalised tables derived from templates, and with regard to the dimensional possibilities within the table.
The table above was created by supervisory experts and is now available for the taxonomy publisher to check the quality requirements. All specified dimensions can be found in the table. The taxonomy publisher is not perfectly acquainted with the business requirements derived from the new legislation. However, he checks the table for comprehensibility, and the technical constraints required in order to infer the taxonomy from the DPM. The business requirements need to be reviewed by supervisory experts.
In the table shown in Figure 23, redundancies can be recognised. Looking at the annotations on the right hand side of the table, we detect the redundancy of MKR EQU in two dimensions: MC and RT, which stand for main category and risk type. The risk type differs in some cases between MKR EQU risk, MKR EQU general risk, MKR EQU specific risk, and MKR not look-through CIUs risk. The information that the members of the domain “risk type” refers to, the approach “market risk for equities”, is repeated for each member. If those members are combined in one Data Point, with the member “market risk” of the domain “approach”, then the information is redundant in both domains. It needs to be ensured where the approach dimension is stored, i.e., together with the risk type, to reduce the number of domains, or in separate domains, one for risk type and one for approach.
If a taxonomy publisher detects such an inconsistency, he should get in contact with you to explain his concerns and ask for a justification of the different domains and respective dimensions used for this table. After the data model is finalised, it should be checked that it fully reflects all requirements for the generation of the corresponding taxonomy.
Distribute Data Point Model
Finally, the DPM can be forwarded to the appropriate department for creating a taxonomy and initiating the following process steps. The creation of the taxonomy will be followed by a quality assurance process before it is saved and published. If the quality assurance for the taxonomy fails due to an erroneous DPM, the process of DPM modelling will be iterated until the taxonomy is approved for publication.
What the future holds for us
In order to help you in your task to create and review Data Point Models, software has been developed. As the marketplace realises the possibility of increased sales, new applications for the creation of XBRL taxonomies will be introduced soon. One program that is considered user-friendly for the purpose of creating a DPM is DPM Architect for XBRL, developed by the Banco de España and first introduced at XBRL Week in May 2012. [Banco de España (2012)] The software cannot only help you to build up and review the DPM, it is also intended to generate XBRL taxonomies, which is the next step in the process. The MKR SA EQU template is used again as an example to show some excerpts of the implementation process for creating a DPM with DPM Architect.
The amount type dimension was selected to serve as dimensioned element. Applicable characteristics of the amount type of the MKR SA EQU framework are shown in Figure 24.
- Figure 24 — The attribute for amount type and period type of the dimensioned element of MKR SA EQU
For each member of the dimensioned element, also known as metric, an amount type and a period type have to be defined. The period types are stock and their data types are monetary. Meaningful names were chosen for the metrics (net value, subject to capital value, own funds requirements and total risk exposure amount).
Moreover, the list of dimensions and domains specified can be retrieved.
- Figure 25 — View of dimensions and domains specified for MKR SA EQU
Figure 25 offers a helpful view to check the completeness of the DPM. Furthermore, the informative value of the naming of the dimensions and domains can be examined. An example of a presentation hierarchy is given in the next screen capture (Figure 26).
- Figure 26 — Summary of hierarchies specified for MKR SA EQU
The domain member hierarchies can be seen in a more detailed view, which is illustrated below. The tool also provides the possibility to define aggregations for calculation purposes (Figure 27).
- Figure 27 — Hierarchies for selected domains of MKR SA EQU
Finally, a table can be visualised. Figure 28 shows the row column codes of each cell, which correspond to a Data Point defined by the DPM Architect. Non-existent combinations are greyed out so that they cannot be reported. If the table generated by the tool corresponds to the template originally defined by you, you have done a great job at creating a perfect DPM.
- Figure 28 — Table generated by DPM Architect to summarise the information given during the creation process of the DPM
The tool is already available for testers, and is used to produce taxonomies in production at the Banco de España. DPM Architect will be published on Banco de España´s website this year. Currently, Banco de España is providing the tool only upon request [Banco de España (2012)].
Bibliography
List of literature
[1] Baeumle-Courth P., Nieland S., Schröder H. (2004): Wirtschaftsinformatik, München, Oldenbourg Verlag
[2] Ballard, C./ et al (1998), Data Modeling Techniques for Data Warehousing, Springville: Vervante
[3] Cordts, S./ Blakowski, G./ Brosius,G (2011): Datenbanken für Wirtschaftsinformatiker, Wiesbaden: Vieweg+Teubner Verlag
[4] Ferstl, O., Sinz,E. (2013), Grundlagen der Wirtschaftsinformatik, 7th Edn., München: Oldenbourg Wissenschaftsverlag
[5] Groth,R./et al (1983), Projektmanagement in Mittelbetrieben, Planung und Durchführung einmaliger großer Vorhaben, Köln: Deutscher Instituts-Verlag
[6] Heinze,K. (2012), Modernisierung der Datenformate, in: Handbuch Bankenaufsichtliches Meldewesen, Heidelberg: FinanzColloquium Heidelberg, p. 68-92
[7] Kummer, W./Spühler, R./ Wyssen R. (1986), Projekt-Management, Leitfaden zu Methode und Teamführung in der Praxis, 2nd Edn., Zürich: Verlag Industrielle Organisation
[8] Minhorst, A. (2005), Das Access 2003 Entwicklerbuch, München: Addison-Wesley Verlag
[9] Piechocki, M. (2012), Supervising Models: XBRL and Data Point modelling, in: iBR interactive business reporting, Vol. 02, No. 3, p. 26-29
[10] Platz, J./ Schmelzer, H. (1986), Projektmanagement in der industriellen Forschung und Entwicklung, Einführung anhand von Beispielen aus der Informationstechnik, Berlin/Heidelberg/New York: Springer Verlag
[11] w.a. (1982), Systems Engineering. Ein Leitfaden zur methodischen Durchführung umfangreicher Planungsvorhaben, Daenzer (Ed.), 3rd Edn., Zürich: Verlag Industrielle Organisation
List of Internet and intranet sources
[12] 1keydata (2013a), Conceptual Data Model, http://www.1keydata.com/datawarehousing/conceptual-datamodel.
html, retrieval, 22.02.2013
[13] 1keydata (2013b), Logical Data Model, http://www.1keydata.com/datawarehousing/logical-datamodel. html, retrieval, 22.02.2013
[14] 1keydata (2013c), Physical Data Model, http://www.1keydata.com/datawarehousing/physical-datamodel. html, retrieval, 22.02.2013
[15] Banco de España (2012), DPM Architect for XBRL, Update & Demo, www.eurofiling.info/201212/presentations/DPM_Morilla_20121213.ppsx, retrieval, 10.04.2013
[16] Bundesbank (2013), Marktrisikomeldung Aktiennettoposition, http://www.bundesbank.de/Redaktion/DE/Downloads/Service/Meldewesen/Bankenaufsicht/PDF/mkrak_al t.pdf?__blob=publicationFile, retrieval, 25.02.2013
[17] CEN (2009), CEN Workshops, http://www.cen.eu/CEN/Sectors/TechnicalCommitteesWorkshops/Workshops/Pages/default.aspx, retrieval, 29.04.2013
[18] Collins, J. (2013), Comparison of Relational and Multi-Dimensional Database Structures, http://www.alphadevx.com/a/36-Comparison-of-Relational-and-Multi-Dimensional-Database-Structures, retrieval, 28.02.2013
[19] CSB Advocates (2013) , An update on the forthcoming CRD IV Rules - Malta, http://www.hg.org/article.asp?id=30273, retrieval, 24.4.2013
[20] databasedev (2013), Database Design & Normalization, http://www.databasedev.co.uk/database_normalization_process.html, retrieval, 13.03.2013
[21] Declerck, T./ Hommes, R./ Heinze, K. (2013), CEN Workshop Agreement, http://wikixbrl.info/index.php?title=European_Data_Point_Methodology, retrieval, 08.04.2013
[22] EBA (2011a), EBA Consultation Paper on Draft Implementing Technical Standards on Supervisory reporting requirements for institutions, http://www.eba.europa.eu/regulation-and-policy/supervisory-reporting/implementing-technical-standard-on-supervisory-reporting-corep-corep-large-exposures-and-finrep-, retrieval, 15.10.2013
[23] EBA (2011b), Eurofiling, Data modelling and ExcelXBRLGen, http://www.openfiling.info/wpcontent/ upLoads/data/EurofilingWebinar20110713.pdf, retrieval, 28.2.2013
[24] EBA (w.y.a), About us, http://eba.europa.eu/Aboutus.aspx, retrieval, 11.03.2013
[25] EBA (w.y.b), Supervisory Reporting Introduction, http://www.eba.europa.eu/Supervisory- Reporting/Introduction.aspx, retrieval, 02.03.2013
[26] ECB (2013), Number of monetary financial institutions (MFIs), February 2013, http://www.ecb.int/stats/money/mfi/general/html/mfis_list_2013-02.en.html, retrieval, 02.03.2013
[27] Gartner (2012), Semantic Data Model, http://www.gartner.com/it-glossary/semantic-data-model/, retrieval, 08.03.2013
[28] IBM (w.y.), Hierarchien über- und untergeordneter Elemente, http://pic.dhe.ibm.com/infocenter/rdahelp/v7r5/index.jsp?topic=%2Fcom.ibm.datatools.dimensional.ui.doc %2Ftopics%2Fc_dm_pc_hierarchies.html, retrieval, 10.03.2013
[29] Janssen, C. (w.y.), Pivot Table Techopedia explains Pivot Table, http://www.techopedia.com/definition/14649/pivot-table, retrieval, 05.03.2012
[30] Oxford University Press (2013), Oxford Dictionaries, http://oxforddictionaries.com/definition/english/model?q=model, retrieval, 28.02.2013
[31] Rouse M. (2010), Definition data modelling, http://searchdatamanagement.techtarget.com/definition/datamodeling, retrieval, 14.02.2013
[32] Sapia, C./ et al (1999), Extending the E/R Model for the Multidimensional Paradigm, http://link.springer.com/chapter/10.1007%2F978-3-540-49121-7_9?LI=true, retrieval, 10.03.2013
[33] TechTerms (2013a), Data, http://www.techterms.com/definition/data, retrieval, 09.03.2012
[34] TechTerms (2013b), Metadata, http://www.techterms.com/definition/metadata, retrieval, 09.03.2012
[35] Verma, R. (2009a), Slicing, http://www.hypertextbookshop.com/dataminingbook/public_version/contents/chapters/chapter003/section 004/blue/page004.html, retrieval, 10.03.2013
[36] Verma, R. (2009b), Dicing, http://www.hypertextbookshop.com/dataminingbook/public_version/contents/chapters/chapter003/section 004/blue/page004.html, retrieval, 10.03.2013
[37] Wayne State University (2013), S.M.A.R.T. Objectives, http://wayne.edu/hr/leads/phase1/smartobjectives. php, retrieval, 15.03.2013
[38] XBRL Spain (2012), Main Page, Note to the readers, http://wikixbrl.info/index.php?title=Main_Page, retrieval, 10.04.2013
[39] ZaZa Network (2007), Database Development Overview, http://www.zazanetwork.com/resources_services/articles/databases/database_development.aspx#top, retrieval, 28.02.2013
Further Literatur and internet sources:
[40] Flory, A (1982), Bases de Données, Conception et realization”, Paris, Edit Economica
[41] Tsichritzis, D. and Lochovsky, F.H. (1982), Data Models. Englewood Cliffs.
[42] Dittrich (1994), “Object-Oriented data Model concepts”, In advances in Object-Oriented Database Systems. Proceedings of the NATO advanced study Institute on Object-Oriented Database Systems, 1993.
[43] Dogac, M. Tamer Özsu, Alexandros Biliris and Timos Sellis. Springer-Verlag, 1994, pages 30-45.
[44] Date CJ (1995) An introduction to database systems (6th edit), Addison-Wesley, Reading, MA
[45] Santos I, Castro E (2011) XBRL Interoperability through a Multidimensional Data Model. IADIS Internacional Conference on Internet Technologies & Society (ITS 2011). Shanghai, China, December 8th-10th, 2011.
[46] Codd E F (1970) A Relational Model of Data for Large Shared Data Banks. Comunications of the ACM, volume 13, number 6, June, 1970.
[47] Date C J (1990) An Introductuon to Database Systems. Addison-Wesley.
[48] Zaniolo C (1982) A New Normal Form for the Design of Relational Database Schemata. ACM Transactions on Database Systems, 7, 3, 489-499.
[49]Gräning A, Felden C, and Piechocki M. (2011) Status Quo and Potential of XBRL for Business and Information Systems Engineering. In Business & Information Systems Engineering, July 12th, 2011, Vol. 3: Iss. 4, 231-239.
[50] Weber, A. (2013) Data Point Methodology - Guidance for the preparation of data point models based on European supervisory reporting frameworks, Bachelor thesis of the BW Cooperative State University. May, 2013
